


In the last 24 hours, the price of PI – the native token of Pi Network – has experienced an impressive growth of 54.4%. At one point, the price even reached as high as $3, marking a new all-time high. Some experts believe that the price could touch $4 in the near future. However, certain technical indicators suggest that the possibility of a sharp correction in the Pi market cannot be completely ruled out. Let’s examine the scenario deeper!
Pi Network’s Price Surge & Market Performance
At the start of February 20, the PI price was around $0.1008. On the first day of the launch, the PI market witnessed an impressive single-day growth of 765.87%. On the same day, the market touched a peak of $2.208. On the second day, probably due to the aggressive profit-taking action by the early investors of Pi Network, the market experienced a small correction of 17.55%. Although between February 22 and 25, the market recorded a growth of 121.94%, it failed to break above the Feb 20 ATH during the period.
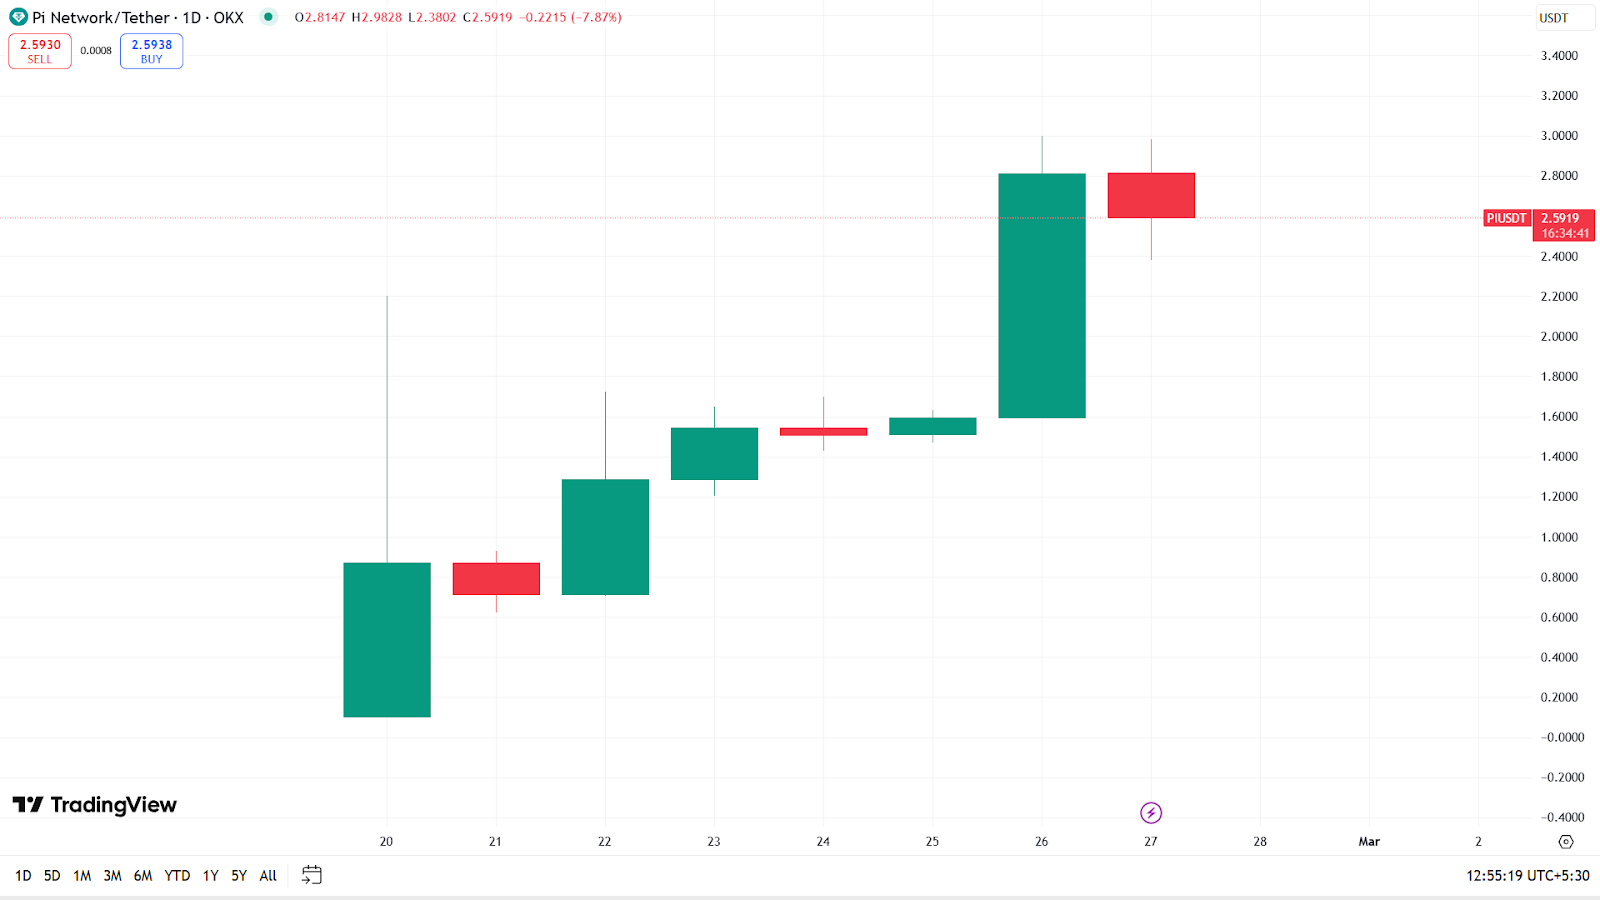
Yesterday, with a strong single-day growth of 76.01%, the market broke above the Feb 20 peak, and it marked a new ATH of $3.
DMI Indicator Signals a Strong Bullish Trend
The Directional Movement Index indicator on the four-hour chart of Pi Network shows that the ADX value of the market stands at 59, +DI at 36.88 and -DI at 5.92. The indicator suggests that the market is currently supported by a very strong uptrend.

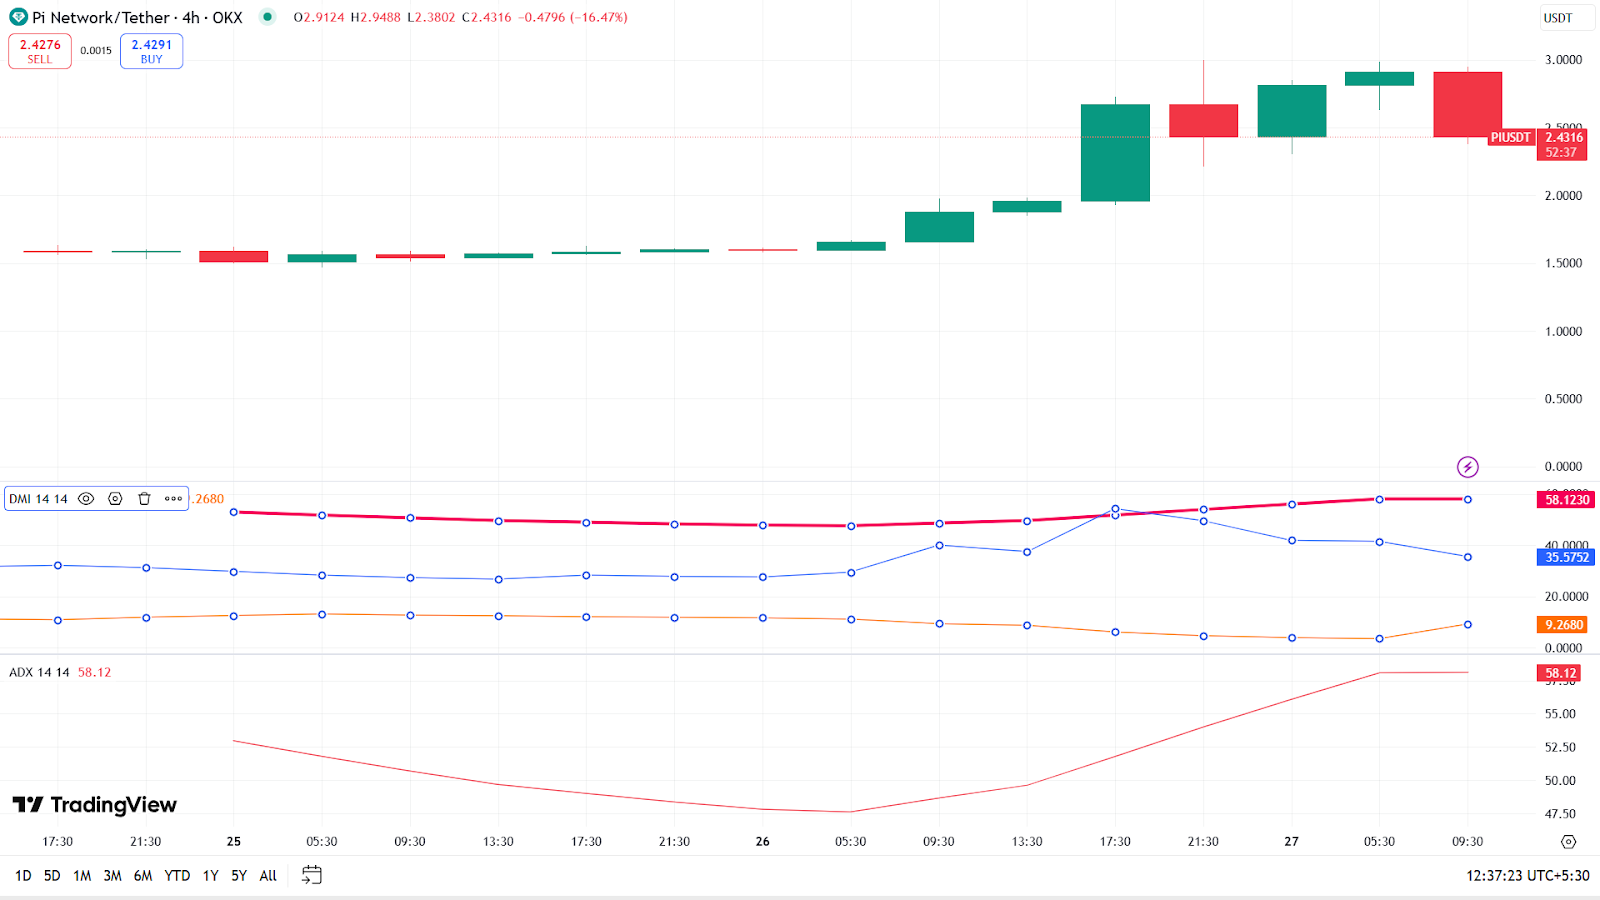
DMI is a technical indicator used in crypto trading to measure trend strength and direction. It consists of three primary components: Average Directional Index (which measures the strength of a trend), Positive Directional Index (which shows buying pressure) and Negative Directional Index (which shows selling pressure).
BBTrends Signals Possible Correction Ahead
The BBTrend reading on the two-day chart of Pi Network remains at -9.1491. Notably, at one point on February 24, it was above 50.

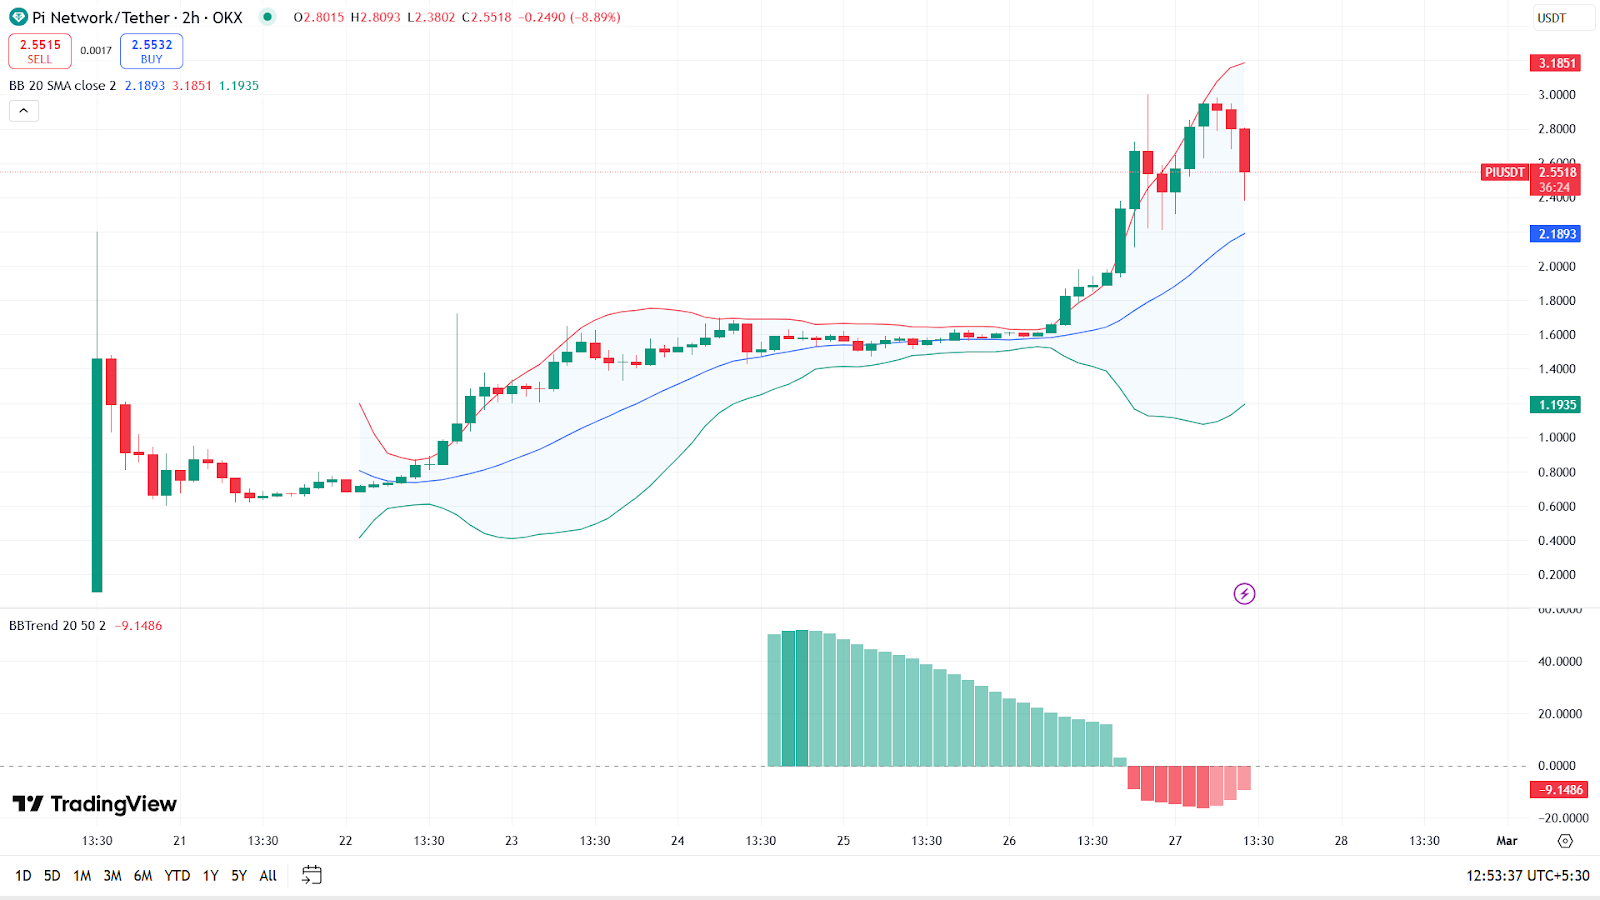
What this indicator actually measures is the price movement of an asset relative to Bollinger Bands.
The sharp drop, which usually happens when the price is overextended, suggests that the Pi network could experience a severe correction or consolidation in the near future.
The Bollinger Band indicator on the two-day chart of PI shows that the upper band of the asset remains at $3.1846, the baseline at $2.1894 and the lower at $1.1936.
Currently, the PI price stands at $2.5799.
Key Price Levels: What to Watch Next in Pi Network?
Experts predict that if the PI market continues its strong upward momentum and breaks above the $3.5 psychological barrier, it could reach a new peak of $4.
However, experts warn that if the BBTrend technical signal materialises into the PI market price action, it could push the price of PI to a low of $1.7.
Experts also add that if the market experiences strong downward pressure, the PI price could even slip to a low of $0.79.


Kommentar hinterlassen