


The price of the Frog-themed Pepe coin (PEPE) has lost 6.50% in the last seven days. This decline could be linked to a major supply wall that has overpowered the underlying support.
Due to this rejection, PEPE’s price is currently trading at $0.0000098. In this on-chain analysis, BeInCrypto explains how this development could mean an extended downturn for the meme coin.
Pepe Faces Huge Supply Wall
According to the In/Out of Money Around Price (IOMAP) data, approximately 5,300 Pepe addresses hold 23.84 trillion tokens, which they accumulated at around $0.0000010. This group is currently holding the meme coin at a loss.
The IOMAP typically classifies addresses into those in profit, at breakeven, or out of the money. When a significant volume of addresses is out of the money at a specific price, it creates resistance at that level.
Conversely, when there’s more volume in the money, it represents a support area. In Pepe’s case, the volume at $0.000010 far exceeds that at $0.0000090, suggesting the token might struggle to break above the $0.000010 resistance.
Read more: How to Buy Pepe (PEPE) With a Credit Card: A Step-by-Step Guide

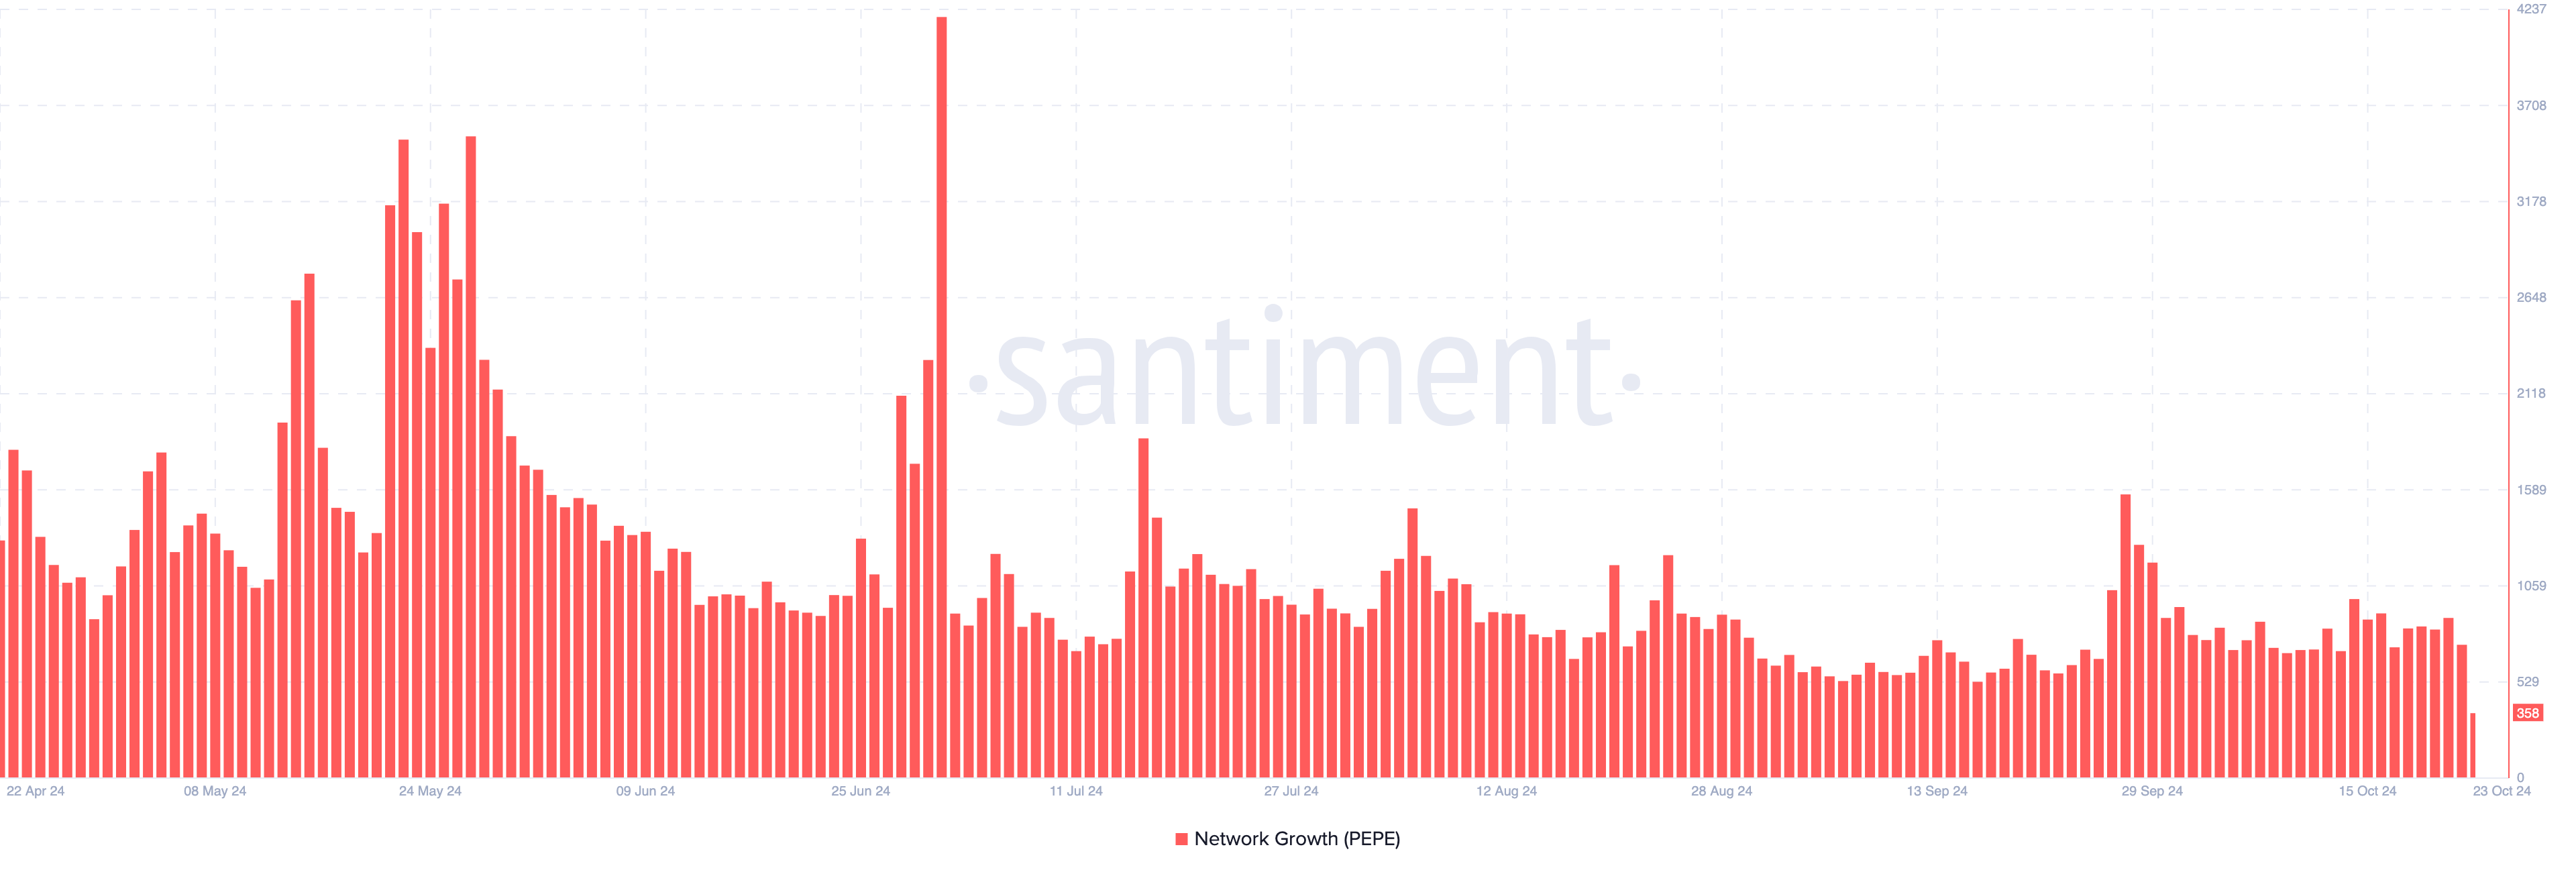
Another factor suggests a price decrease in the Network Growth. This metric measures the number of new addresses interacting with a cryptocurrency.
When the reading increases, it means that the number of market participants making their first successful transaction has increased. A decrease, on the other hand, indicates that traction on the network has decreased.
If sustained, this decline could translate into less demand for PEPE. In turn, it could become difficult for the price to increase.

PEPE Price Analysis: 28% Decrease Likely
A look at the daily PEPE/USD chart shows that the Moving Average Convergence Divergence (MACD) has dropped to the negative region.
The MACD is a momentum indicator that calculates the difference between two exponential moving averages (EMAs) of an asset’s price, commonly the 12-period EMA and the 26-period EMA.
Traders often use the crossover between the MACD and the signal line to identify potential bullish or bearish momentum. When it is positive, momentum is bullish. On the other hand, a negative reading indicates that the momentum is bearish.
Read more: Pepe (PEPE) Price Prediction 2024/2025/2030

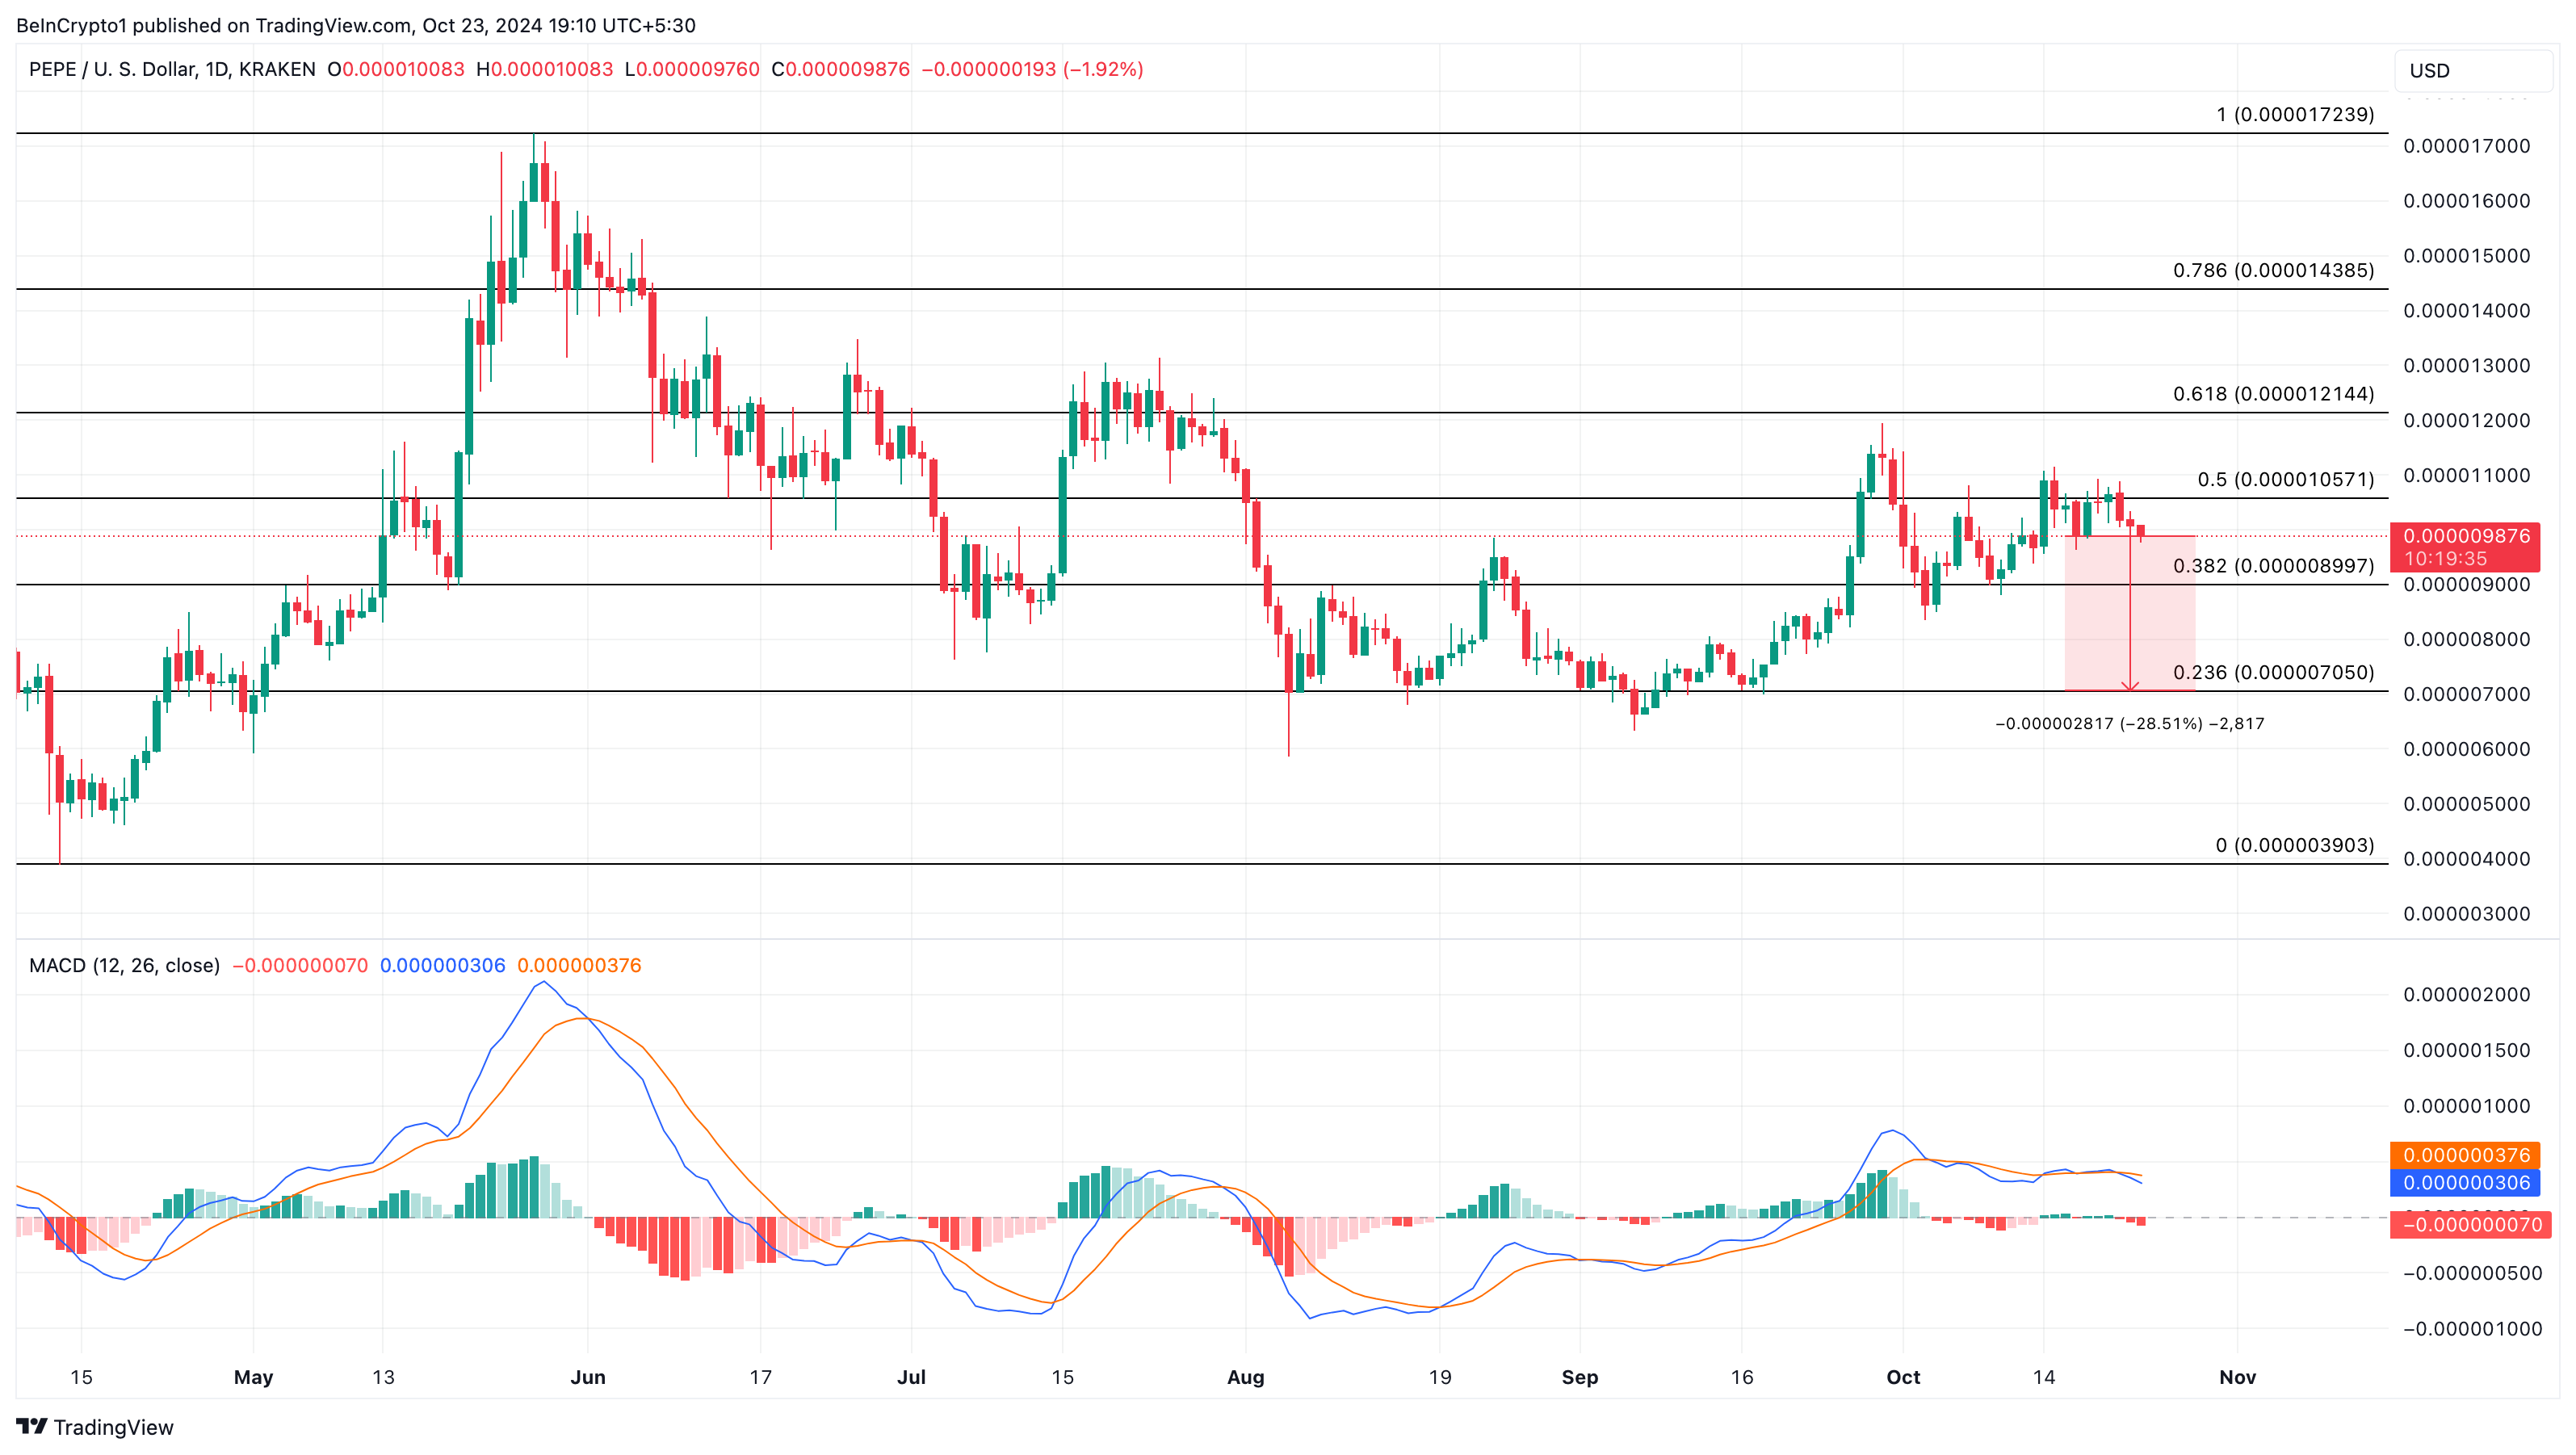
Since it is the latter, this position could further lower the Pepe coin price. Should that remain the case, PEPE’s price might drop by 28% to $0.0000070. However, if buying pressure increases with a volume larger than the one at the current resistance, the price might bounce toward $0.000014.
Disclaimer
In line with the Trust Project guidelines, this price analysis article is for informational purposes only and should not be considered financial or investment advice. BeInCrypto is committed to accurate, unbiased reporting, but market conditions are subject to change without notice. Always conduct your own research and consult with a professional before making any financial decisions. Please note that our Terms and Conditions, Privacy Policy, and Disclaimers have been updated.


Kommentar hinterlassen