


The Monero price has remained under pressure since mid-January, even as parts of the crypto market attempt to stabilize. After falling sharply through late January, the XMR price found support near $276 on February 6 and has since moved slightly higher.
But this recovery looks shaky. Chart patterns, weak dip buying, and mixed sentiment data suggest Monero may still be heading toward another major decline.
Sponsored
Sponsored
Bear Flag Breakdown and Weak Dip Buying Put XMR Under Pressure
Since January 14, Monero has been trading within a declining structure resembling a bearish pole-and-flag pattern. A bear flag is a short consolidation that forms after a sharp drop (ended on February 6 for XMR) and often signals that the downtrend may continue.
After falling more than 60% from its January peak, XMR moved sideways and slightly upward inside this flag. However, as of February 12, the price began slipping below the lower boundary, signaling a potential breakdown. This confirms the bearish breakdown at press time, unless, in the next few hours, some buyers can push XMR back inside the flag.
Momentum data shows that dip buyers are still present, but their strength remains limited. One useful indicator here is the Money Flow Index, or MFI. MFI tracks buying and selling pressure by combining price and volume, making it useful for spotting dip-buying strength.

Want more token insights like this? Sign up for Editor Harsh Notariya’s Daily Crypto Newsletter here.
Since February 1, Monero’s MFI has trended upward (higher lows) while XMR moved sideways and lower. This suggests that some investors are buying dips. But MFI has failed to break above its upper trendline or form a clear higher-high structure. That means buying interest is present, but not strong enough to reverse the pattern weakness.
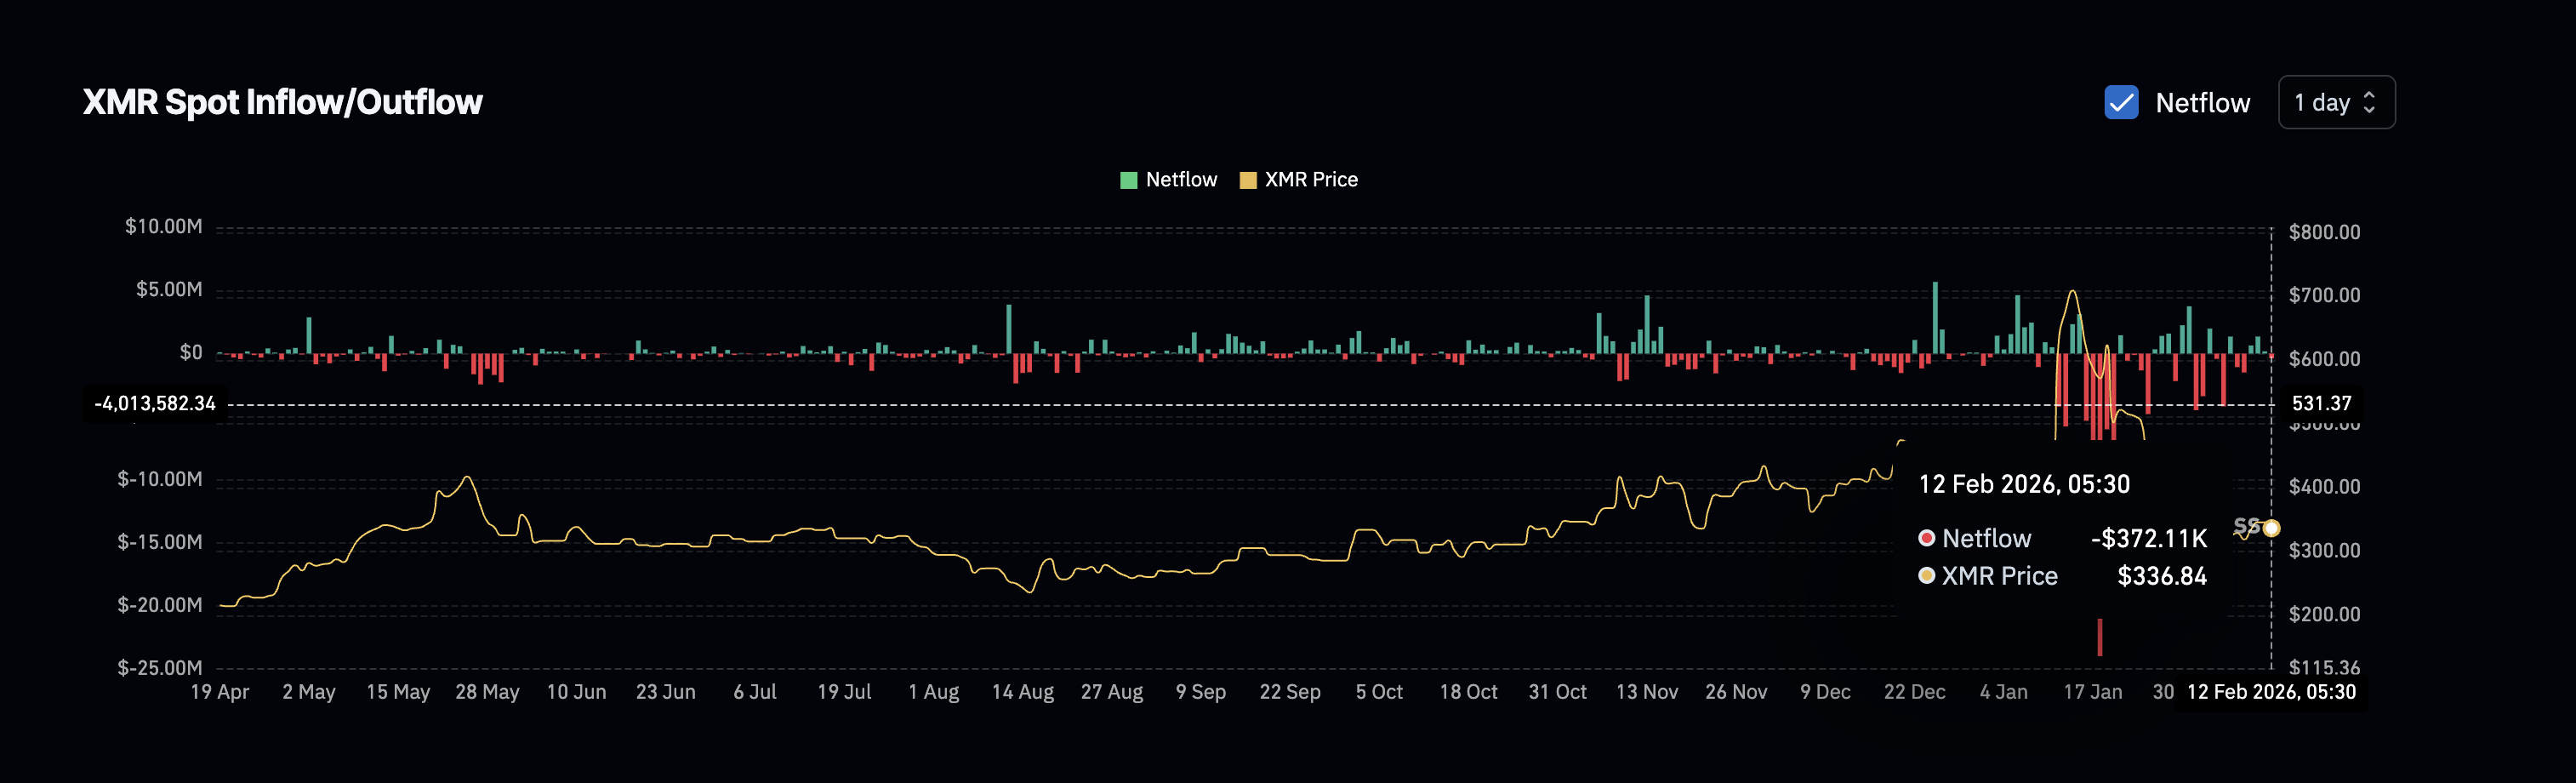
Exchange flow data supports this view. After three days of mild inflows, Monero recorded net outflows again on February 12, with around $372,000 worth of XMR moving out of exchanges. Negative netflow usually signals rising buying pressure.
Sponsored
Sponsored
This shows that some are still buying. In simple terms, dip buyers are active, but only feebly.
Rising Social Interest Fails to Offset Falling Positive Sentiment
Social data shows another important weakness in Monero’s current setup.
Over the past few days, Monero’s social dominance has started to rise. Social dominance measures how much attention a coin receives compared to the rest of the crypto market. When it increases, it means more people are talking about the asset.
Between February 11 and February 12, social dominance rose from around 0.046% to 0.066%. This shows that interest in Monero is picking up slightly after weeks of decline. Historically, rising social activity has sometimes preceded short-term price rebounds.
For example, on January 12, social dominance surged near 0.92%. Within two days, Monero rallied 25%. A similar pattern appeared on January 18, when social interest rose ahead of another short-term price peak. However, the current rise in social dominance is much weaker than in those past cases. It remains well below the February high near 0.106 and far below January’s major spikes.
Sponsored
Sponsored
More importantly, positive sentiment is moving in the opposite direction. Positive sentiment tracks how much of the social discussion is optimistic rather than neutral or negative. Since February 9, Monero’s positive sentiment score has fallen sharply from about 27.26 to just 7.21, a 74% dip. This is a major decline.

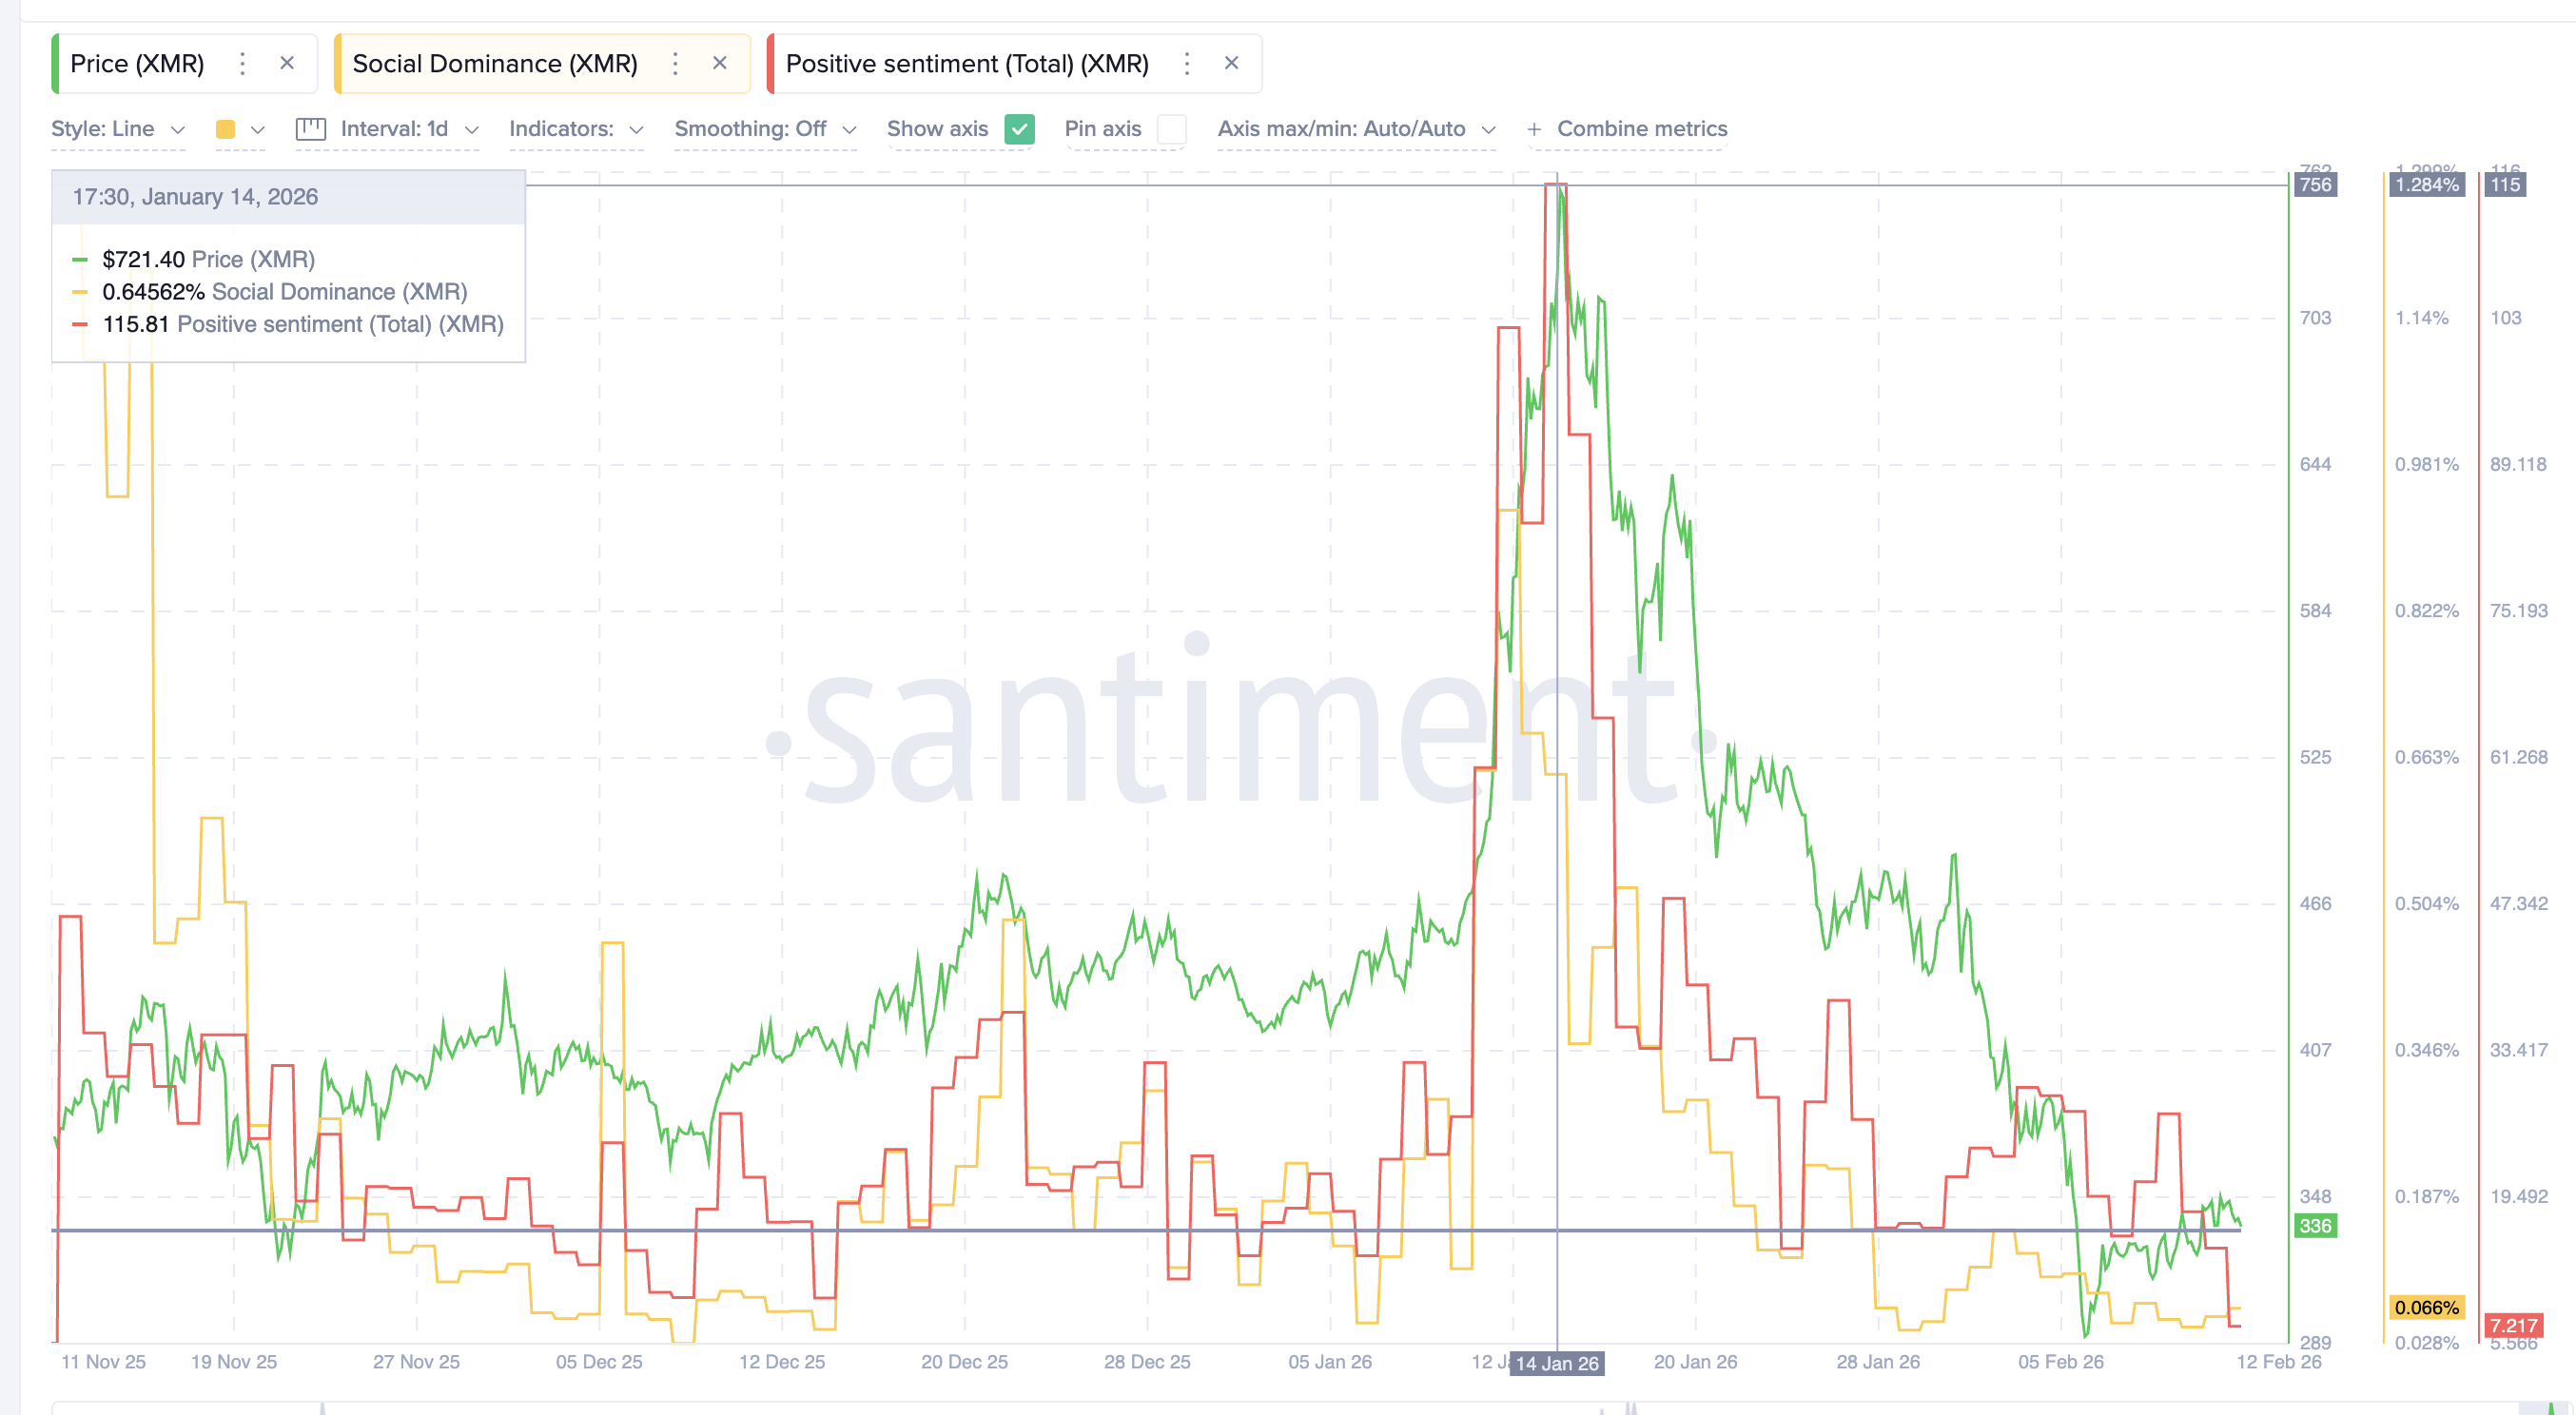
In January, when positive sentiment surged above 100, strong rallies followed. Today, sentiment is collapsing even as social chatter rises. This suggests that people are talking about Monero, but not in a confident or optimistic way. Much of the discussion appears driven by concern, speculation, and downside risk. This weak emotional backdrop makes it harder for any Monero price recovery to sustain momentum.
Monero Price Levels That Determine the Next Leg
With technical weakness and fragile demand, the XMR price levels now matter more than narratives. On the upside, the most important resistance sits near $361, discussed at the end of this section.
This level marks the center of the bear flag structure. A sustained move above $361 would suggest that buyers are regaining control and that the breakdown may be delayed. Not invalidated. Without a recovery above this zone, downside risks remain dominant.
Sponsored
Sponsored
One small positive signal comes from the Bull-Bear Power indicator. This metric compares buying strength against selling pressure to show which side is in control. Recently, bearish power has started to weaken even as the price slipped below key support. This suggests that sellers are losing some momentum.

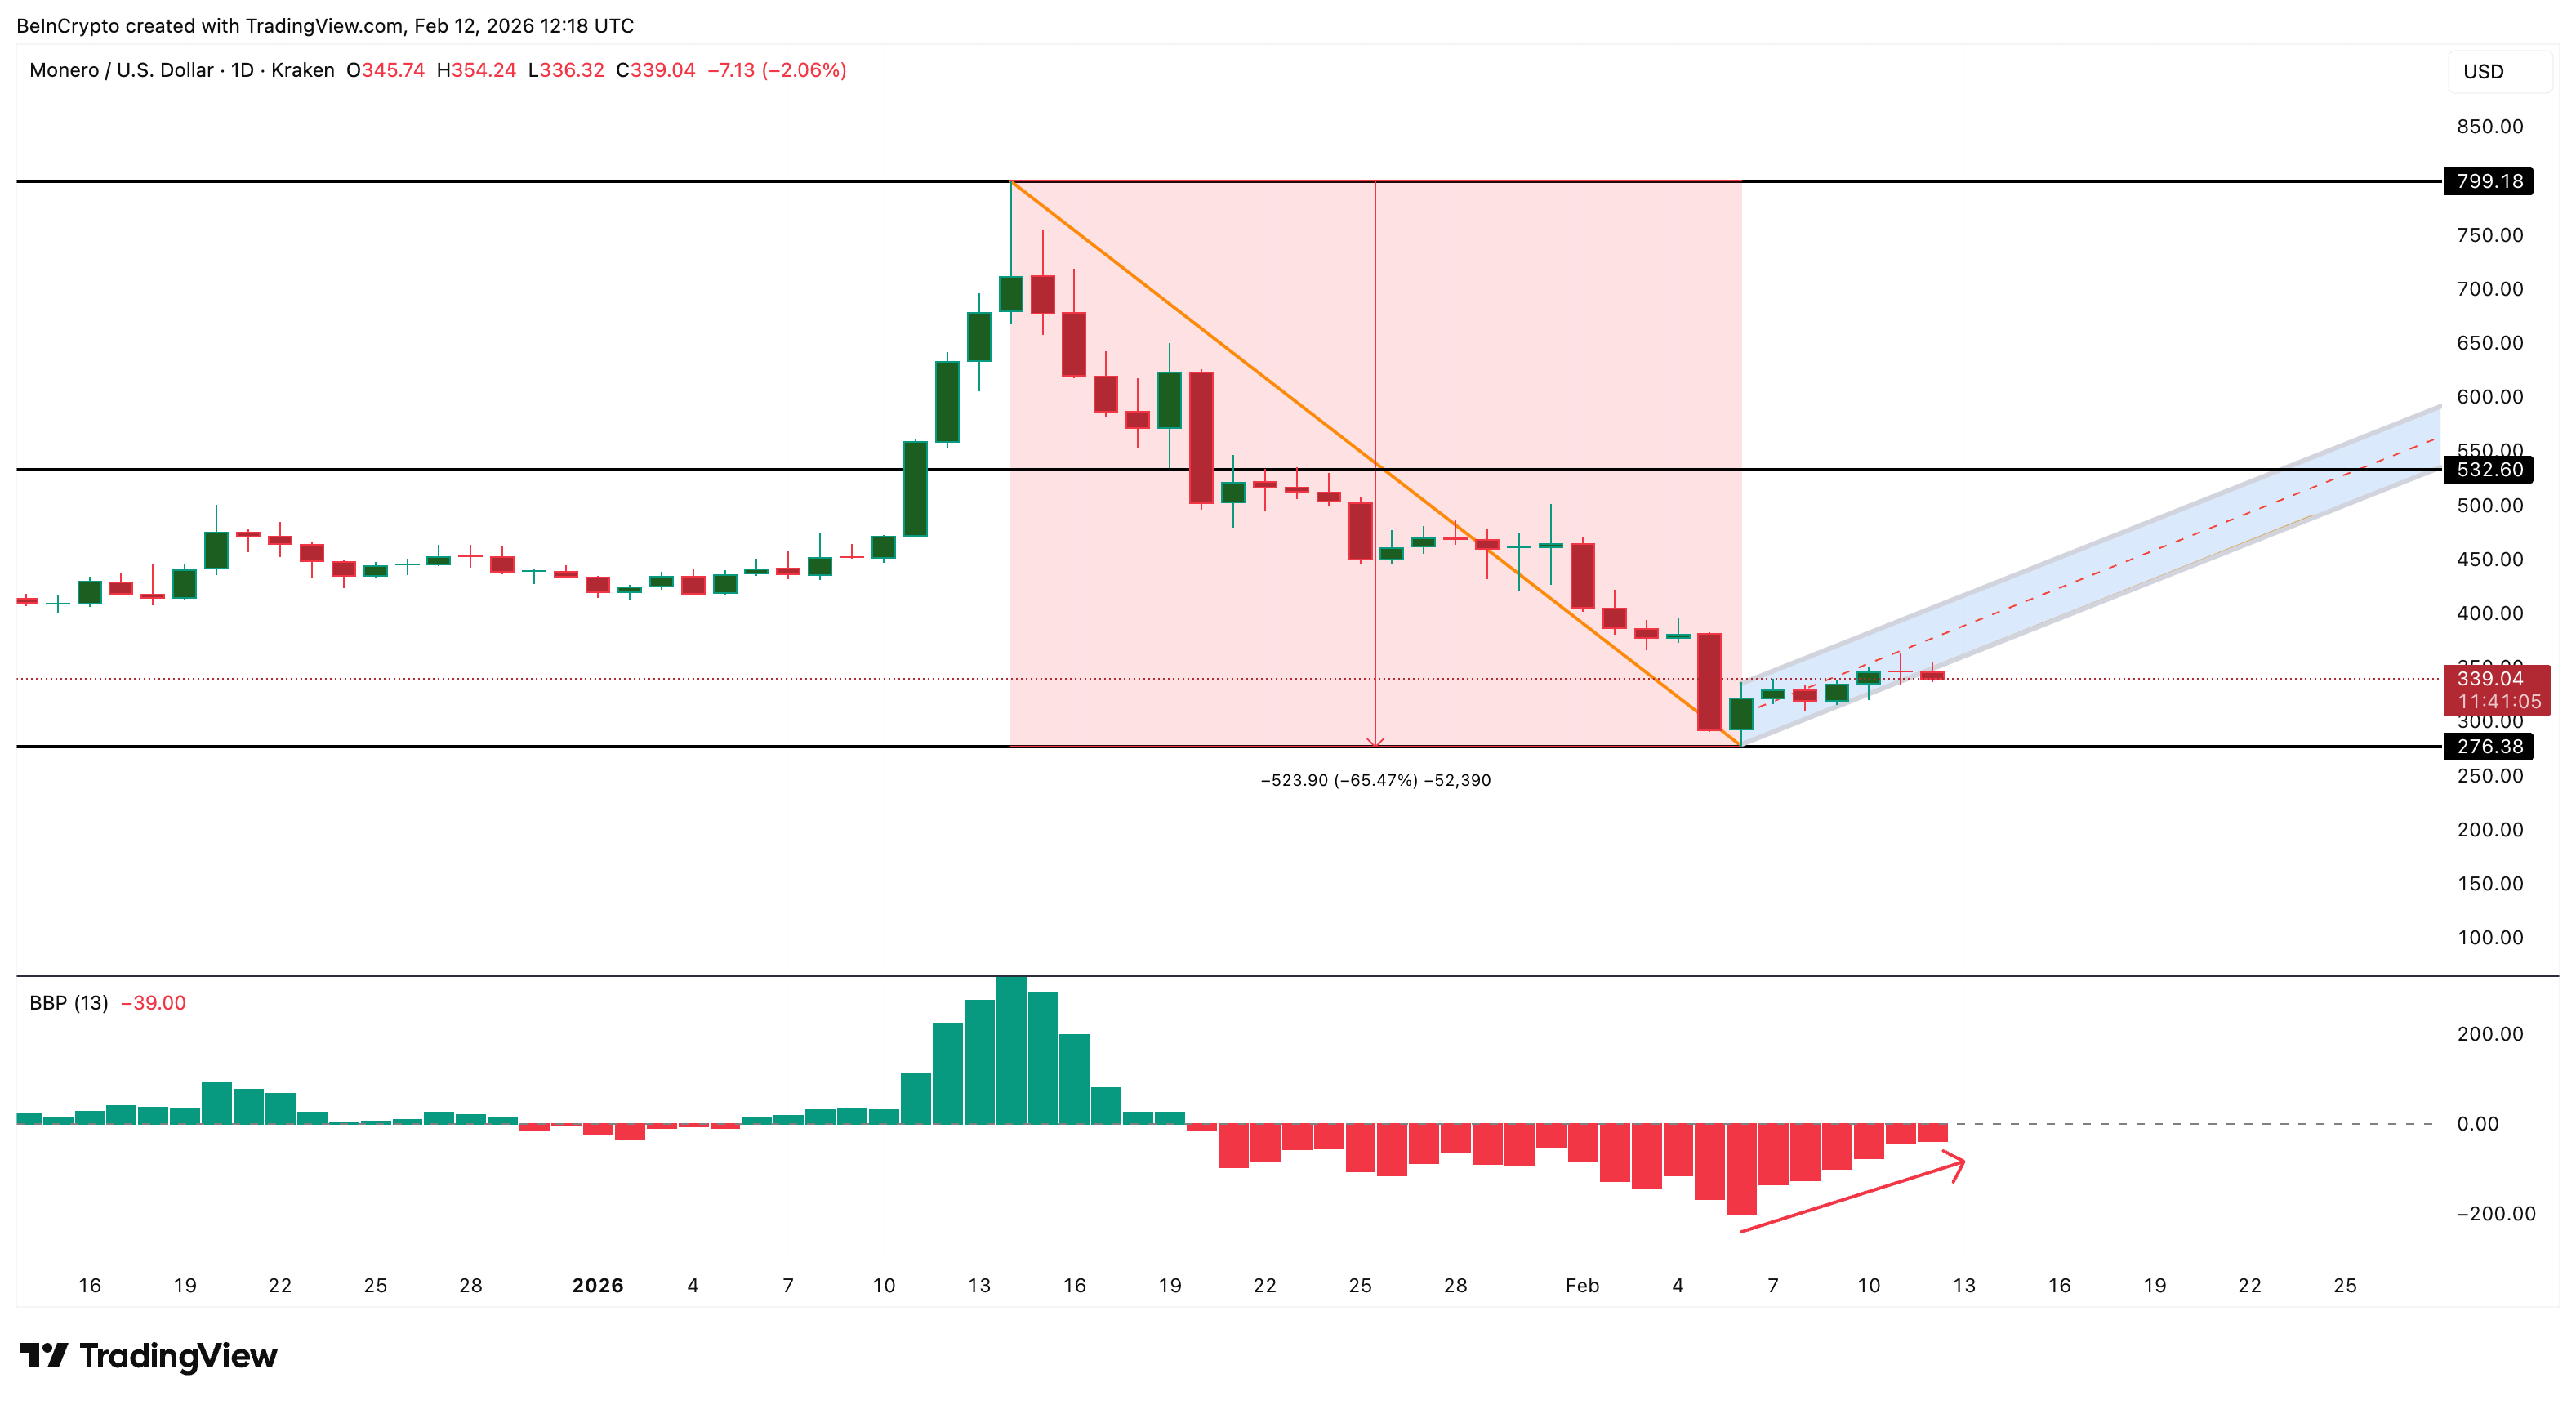
If dip buying remains active while bearish pressure continues to fade, buyers could delay the breakdown and attempt to push XMR back above $361.
On the downside, the first major support lies near $308. This level has acted as a short-term floor several times in recent days. Below $308, the next key support sits near $276, which marked the February low.

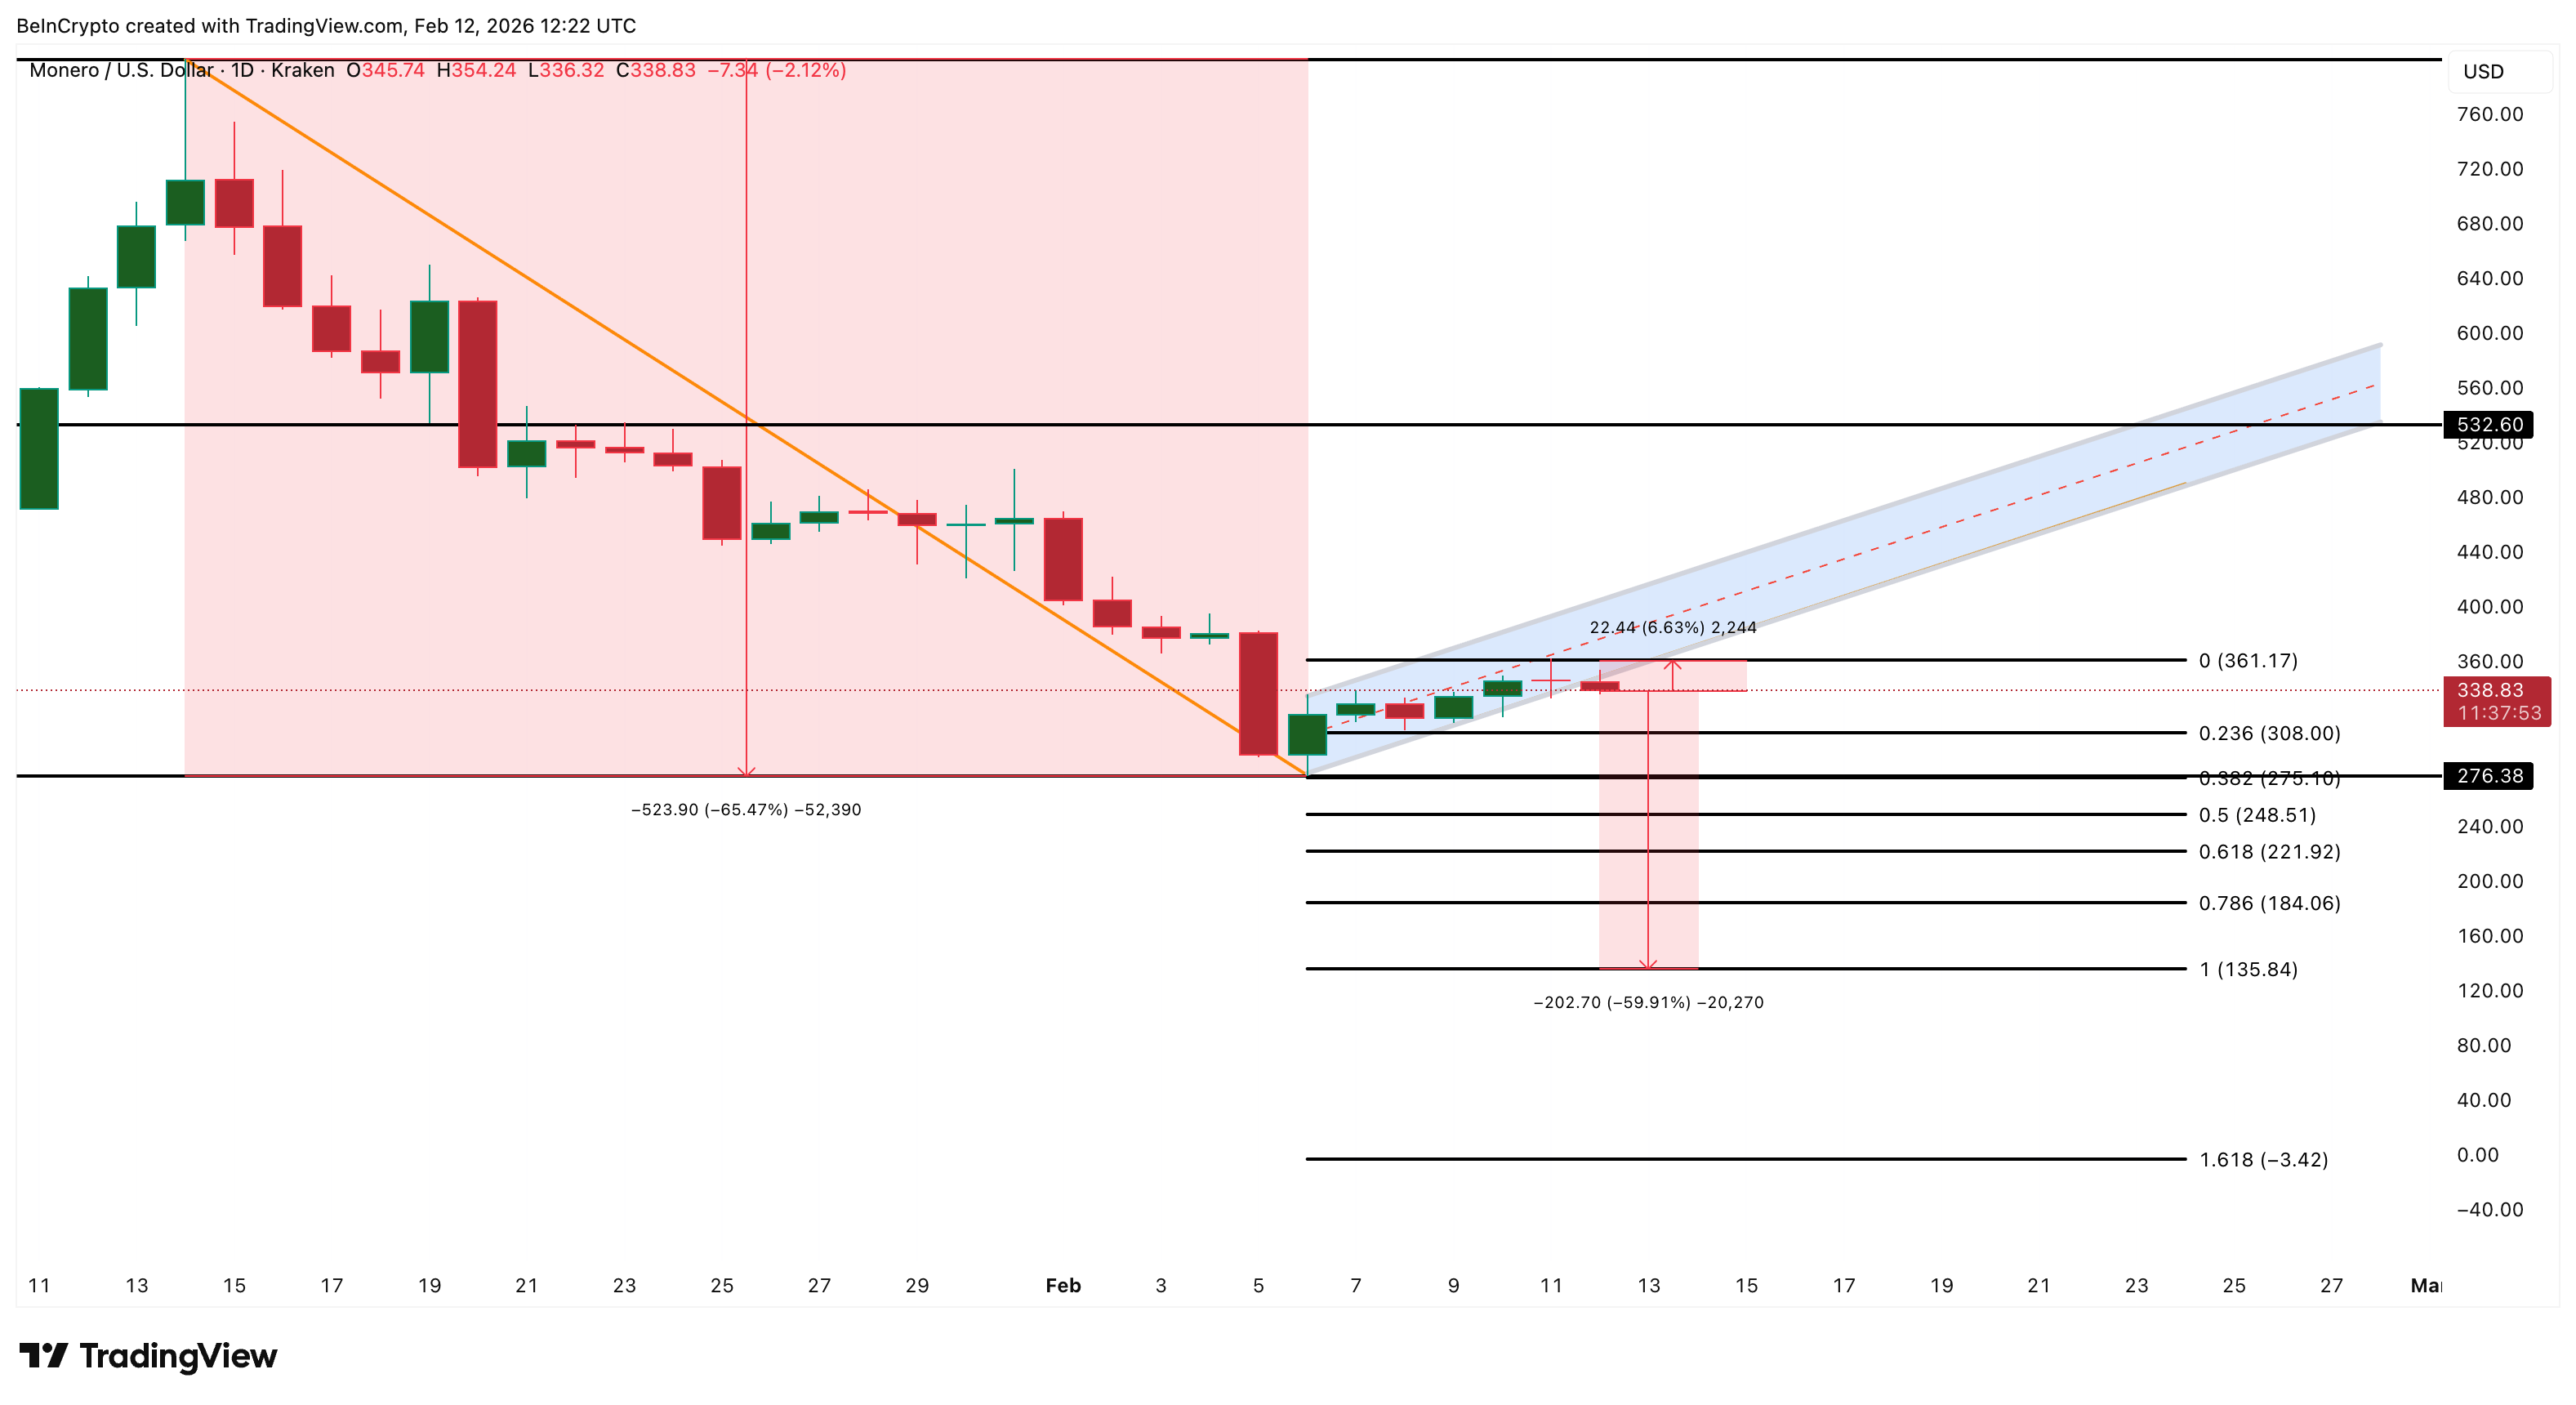
If both levels fail, the bear flag projection points toward the $135 region. This target reflects nearly the full measured move of the prior decline and represents the next major historical support zone.


Kommentar hinterlassen