


Solana price is pulling back, but the structure remains bullish. The 2% day-on-day dip comes as a new Solana-focused ETF was filed, putting SOL back in focus in a relatively volatile crypto market. Despite a mild daily decline, Solana is still up over 8% on the week, holding up better than most large-cap peers.
Beneath the surface, positioning is shifting in ways that support stability rather than weakness.
Sponsored
Sponsored
Morgan Stanley ETF Filing Arrives as Solana Tests a Key Structure
The recent Solana ETF filing by Morgan Stanley on January 6, 2026, adds a fresh narrative layer to an already active chart setup. Even though the price has not reacted sharply, Solana is consolidating near a major bullish pattern as institutional attention increases.
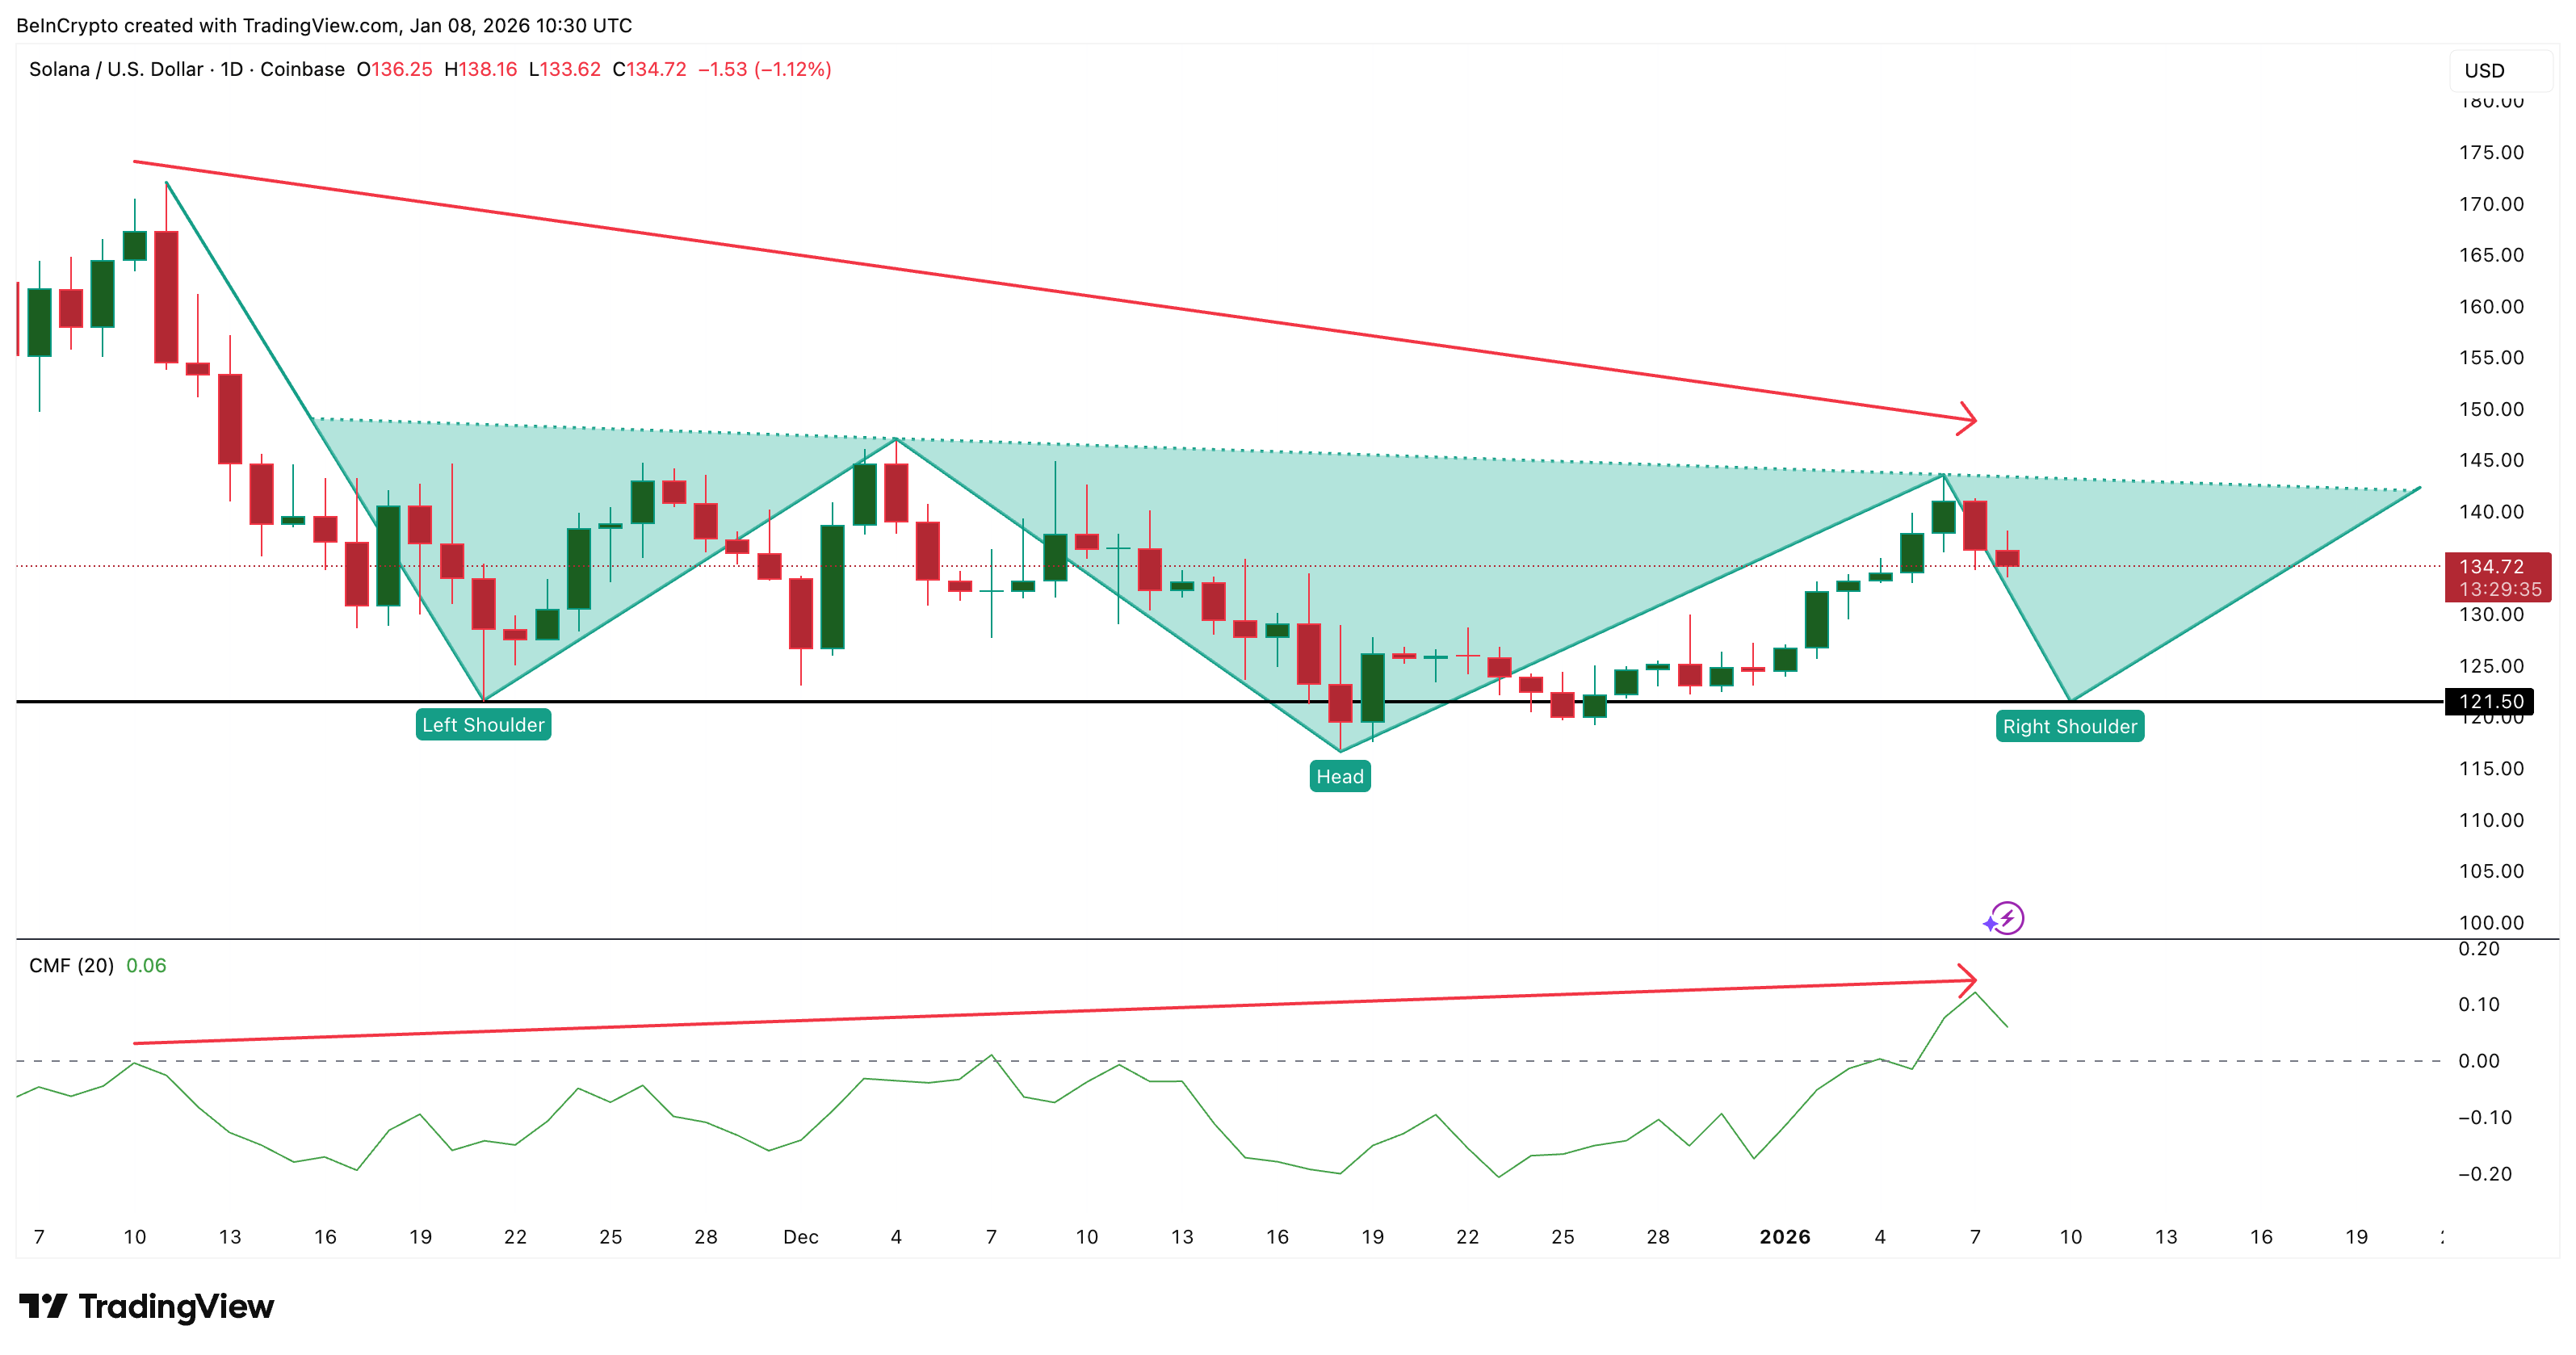
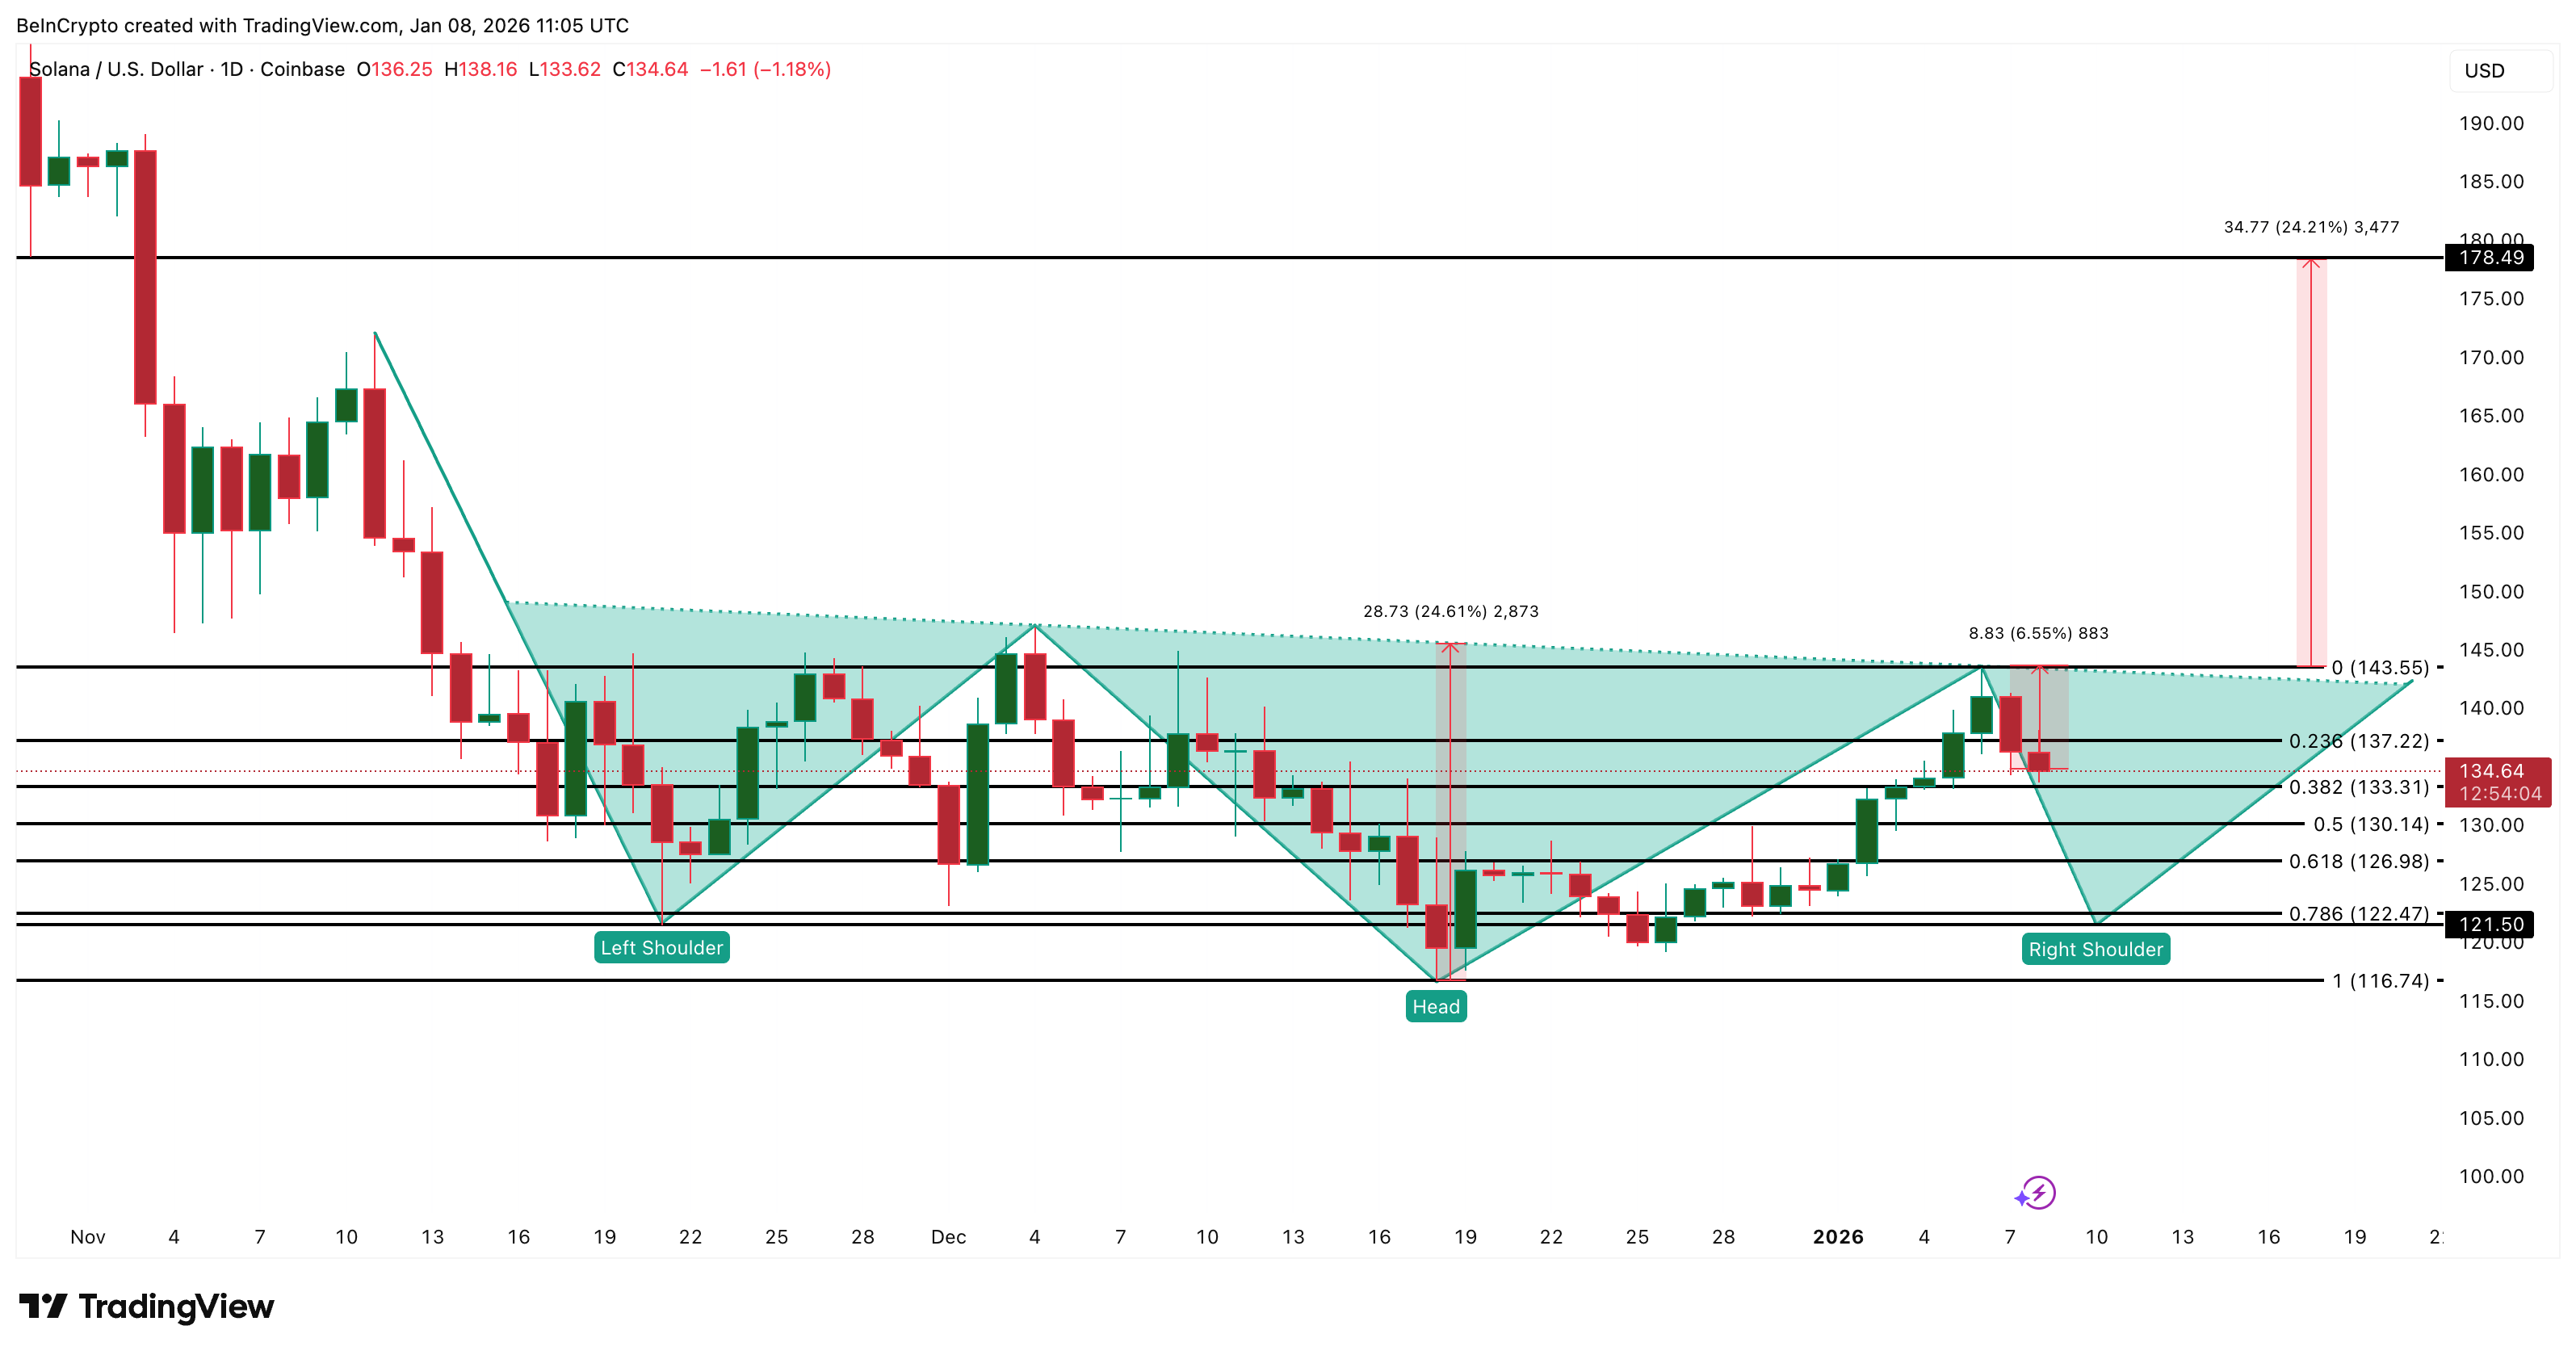
On the daily chart, Solana continues to form an inverse head and shoulders structure. This pattern often signals a potential move higher once confirmed.
The left shoulder formed in late November. The head surfaced in mid-December. The right shoulder is now developing as price pulls back from recent highs.

Want more token insights like this? Sign up for Editor Harsh Notariya’s Daily Crypto Newsletter here.
Even if Solana dips another 8% to 10%, the price would still remain within the left-shoulder zone. For now, $121 seems like a good support zone for a bounce, as this is the level where the left shoulder formed.
A clean break above the neckline would open a measured 24% upside from the breakout level. Therefore, the bullish structure remains intact.
Sponsored
Sponsored
Capital Flow Stays Positive as Speculative Supply Exits
Capital flow data supports the idea that this pullback is controlled. Chaikin Money Flow, which tracks whether capital is entering or leaving an asset, has trended higher since early November.
Even during periods when the Solana price moved lower, CMF continued rising. Most importantly, CMF remains above the zero line, signaling net large inflows. During the latest dip, CMF did not roll over, showing capital has stayed engaged.
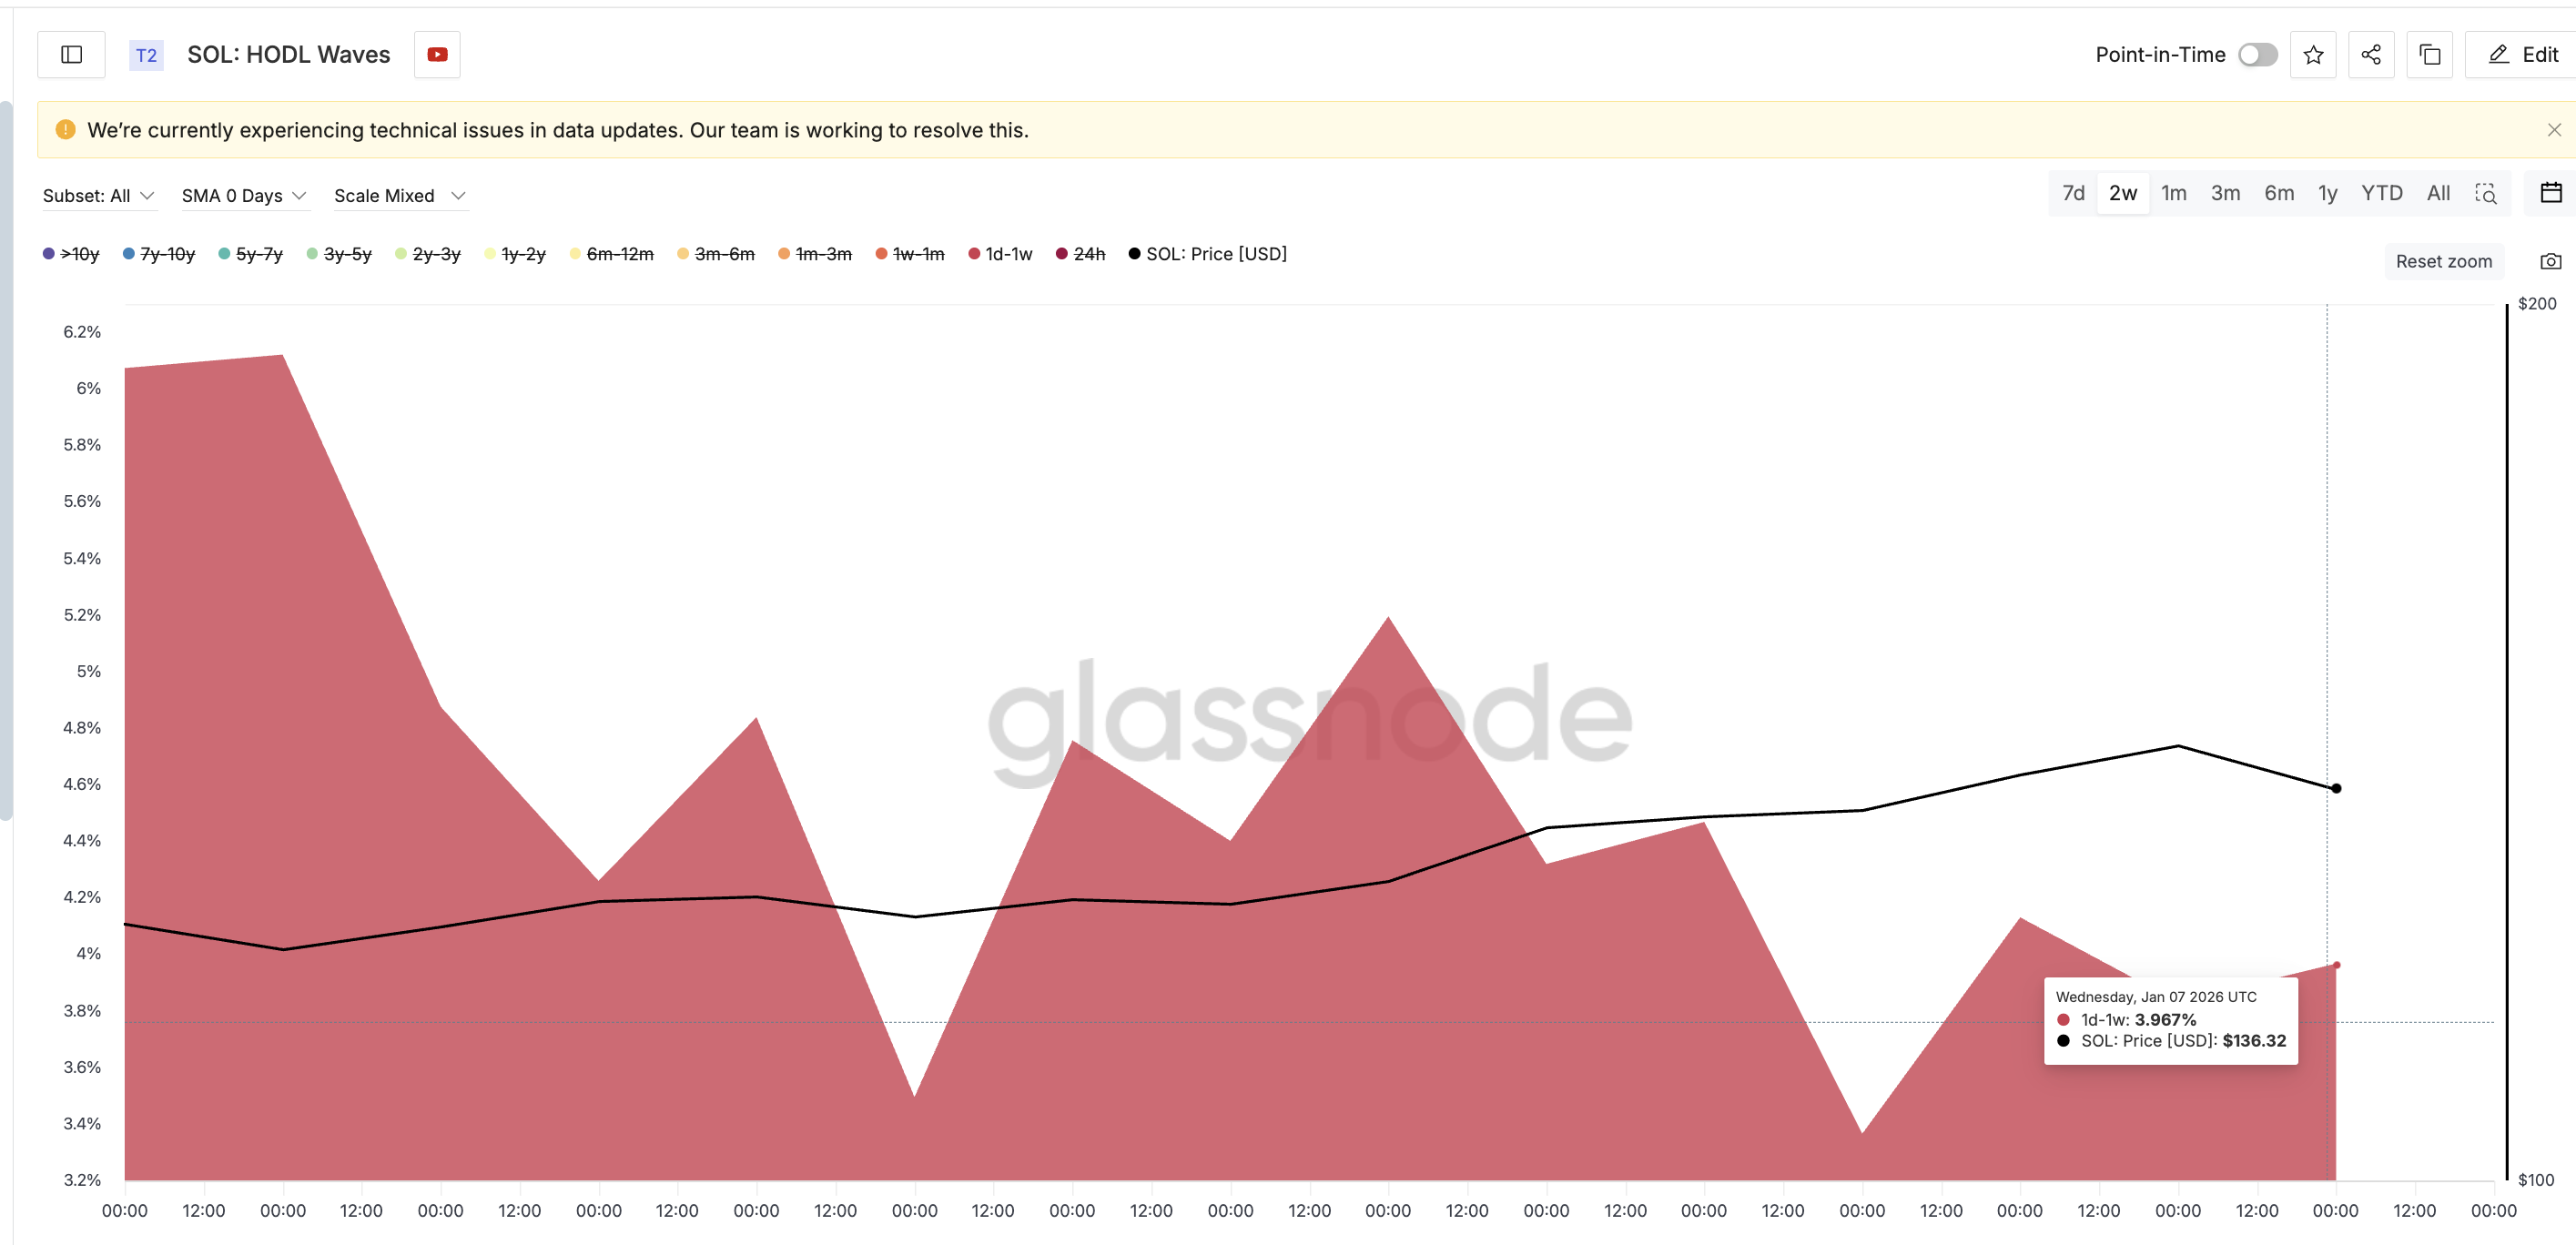
At the same time, speculative supply is clearly leaving, as visible using the HODL Waves metric, which segregates cohorts based on the duration of Solana holdings. Wallets holding Solana for one day to one week reduced their share of supply from about 6.0% to 3.9% between December 24 and January 7. That is a 35% reduction, even as Solana gained nearly 8% over the same period.

Sponsored
Sponsored
Another short-term group, the one-month to three-month holders, also trimmed exposure. Their share fell from 21.57% to 19.95%, a drop of roughly 7.5%.

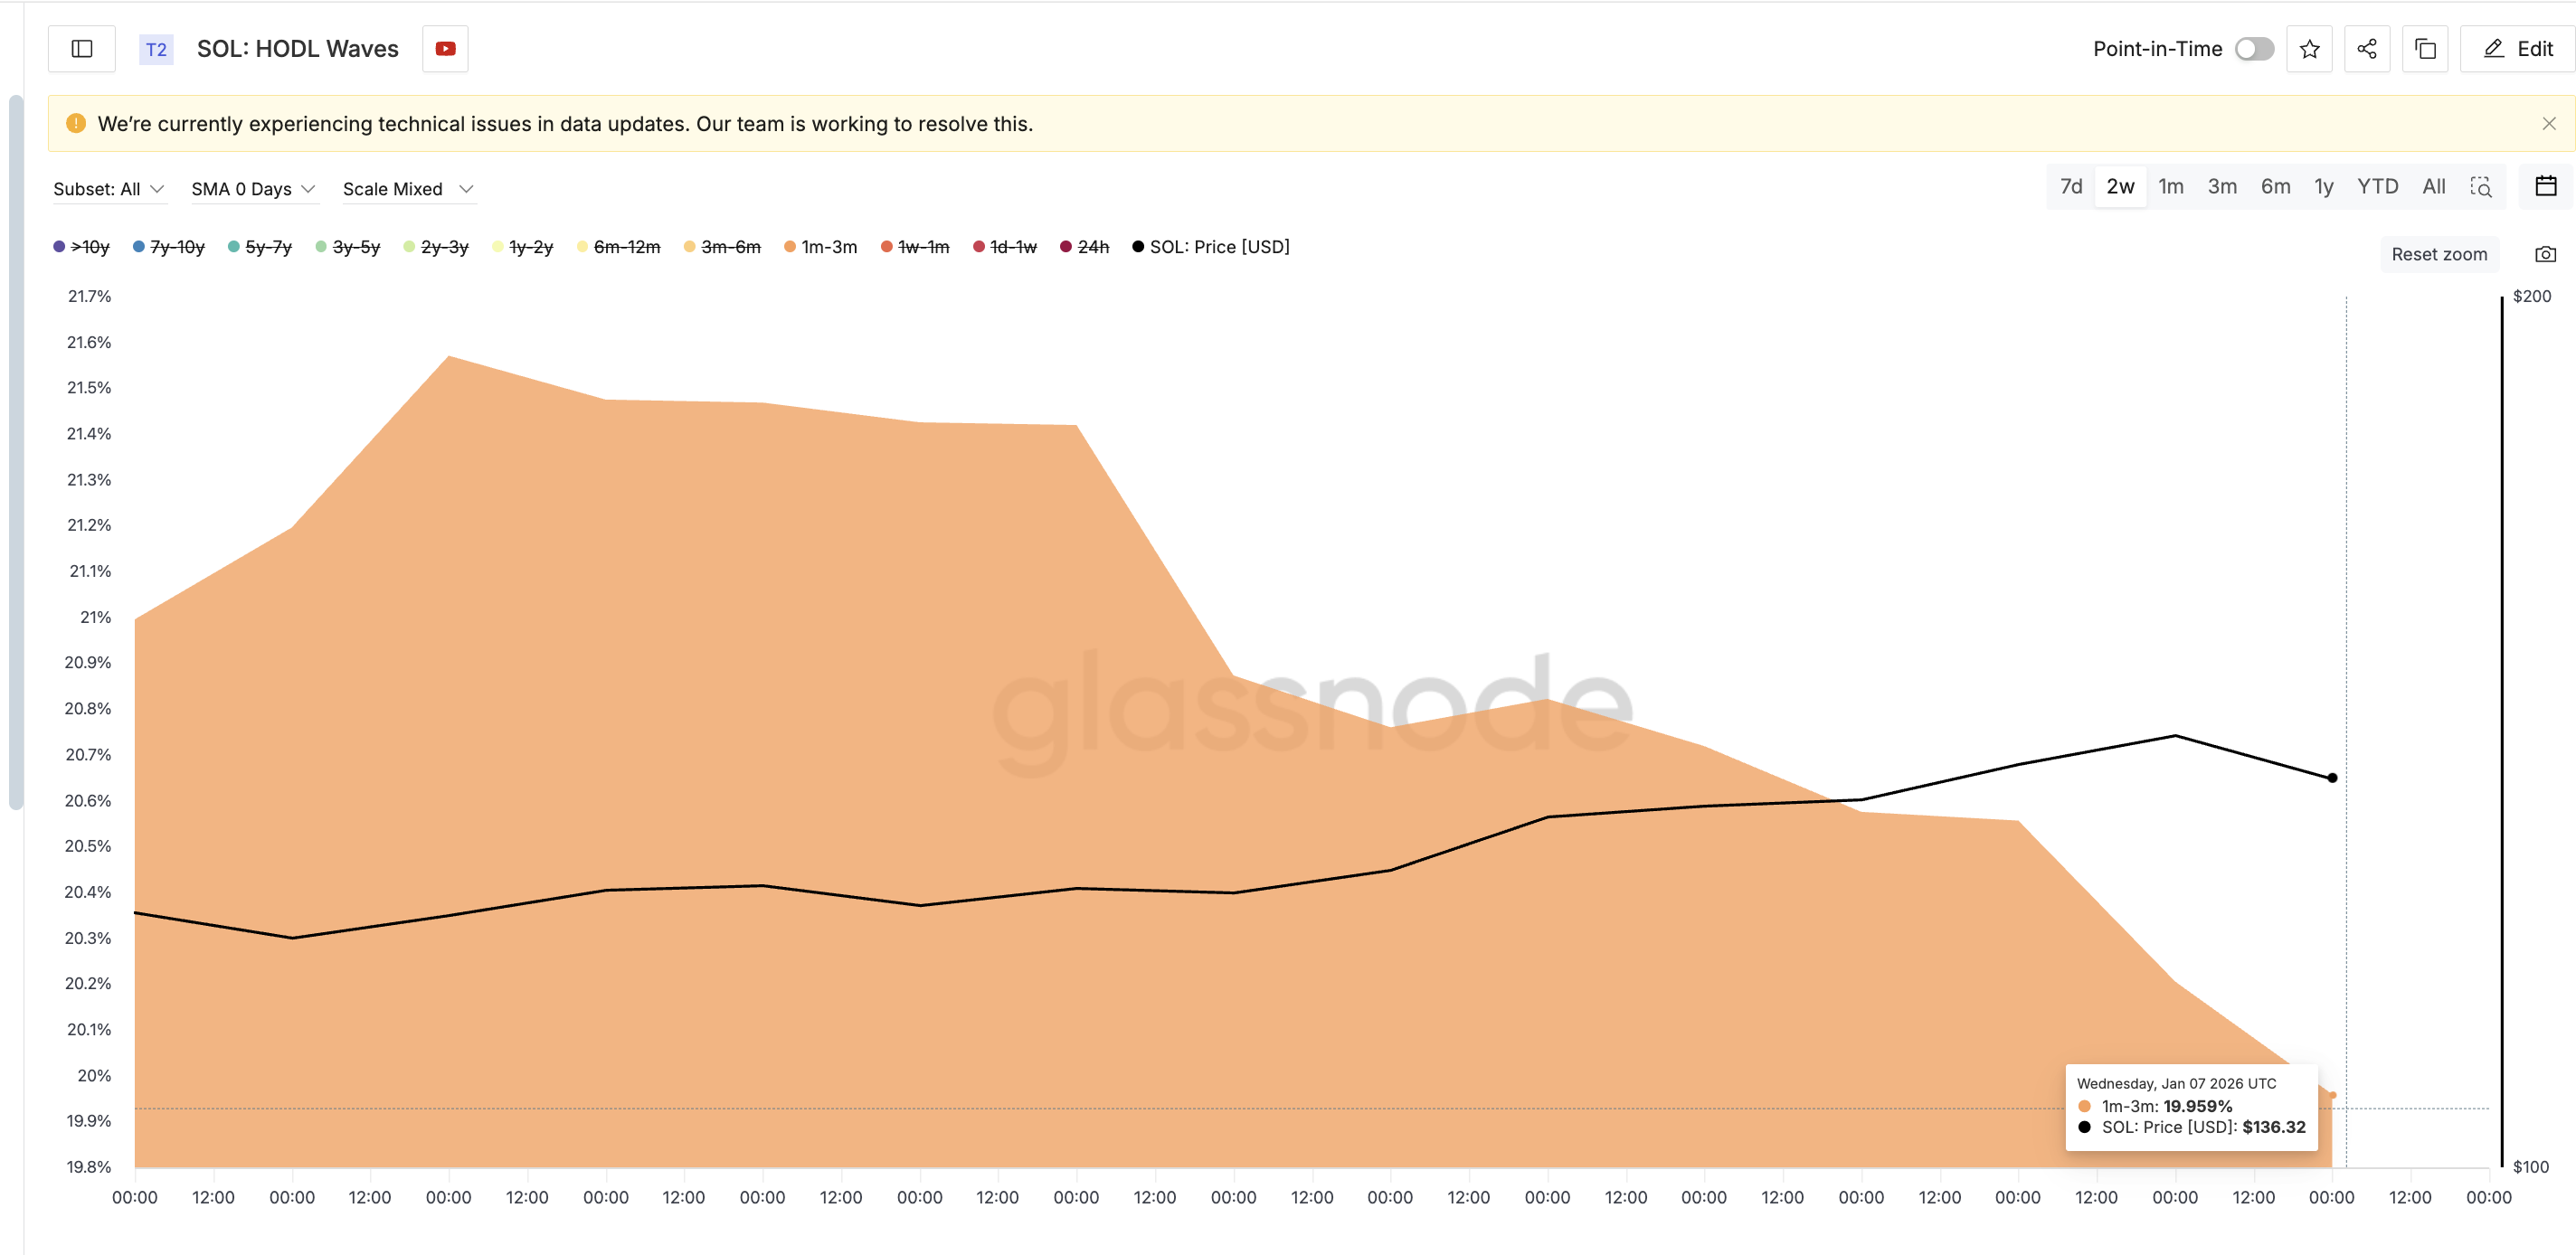
This matters because speculative selling usually pressures the price. This time, price has remained stable, showing that sell pressure is being absorbed.
Buying Pressure Jumps 740% as Strong Hands Absorb Supply
That absorption is clear in the holder net position data, which tracks the position of long-term investors. Since December 24, buying pressure has increased sharply.
Sponsored
Sponsored
Net position change rose from roughly 189,000 SOL to about 1.59 million SOL by January 7. That represents a 740% increase in net buying pressure in under two weeks. January 7 saw the largest inflow, the day after the ETF product was made public.

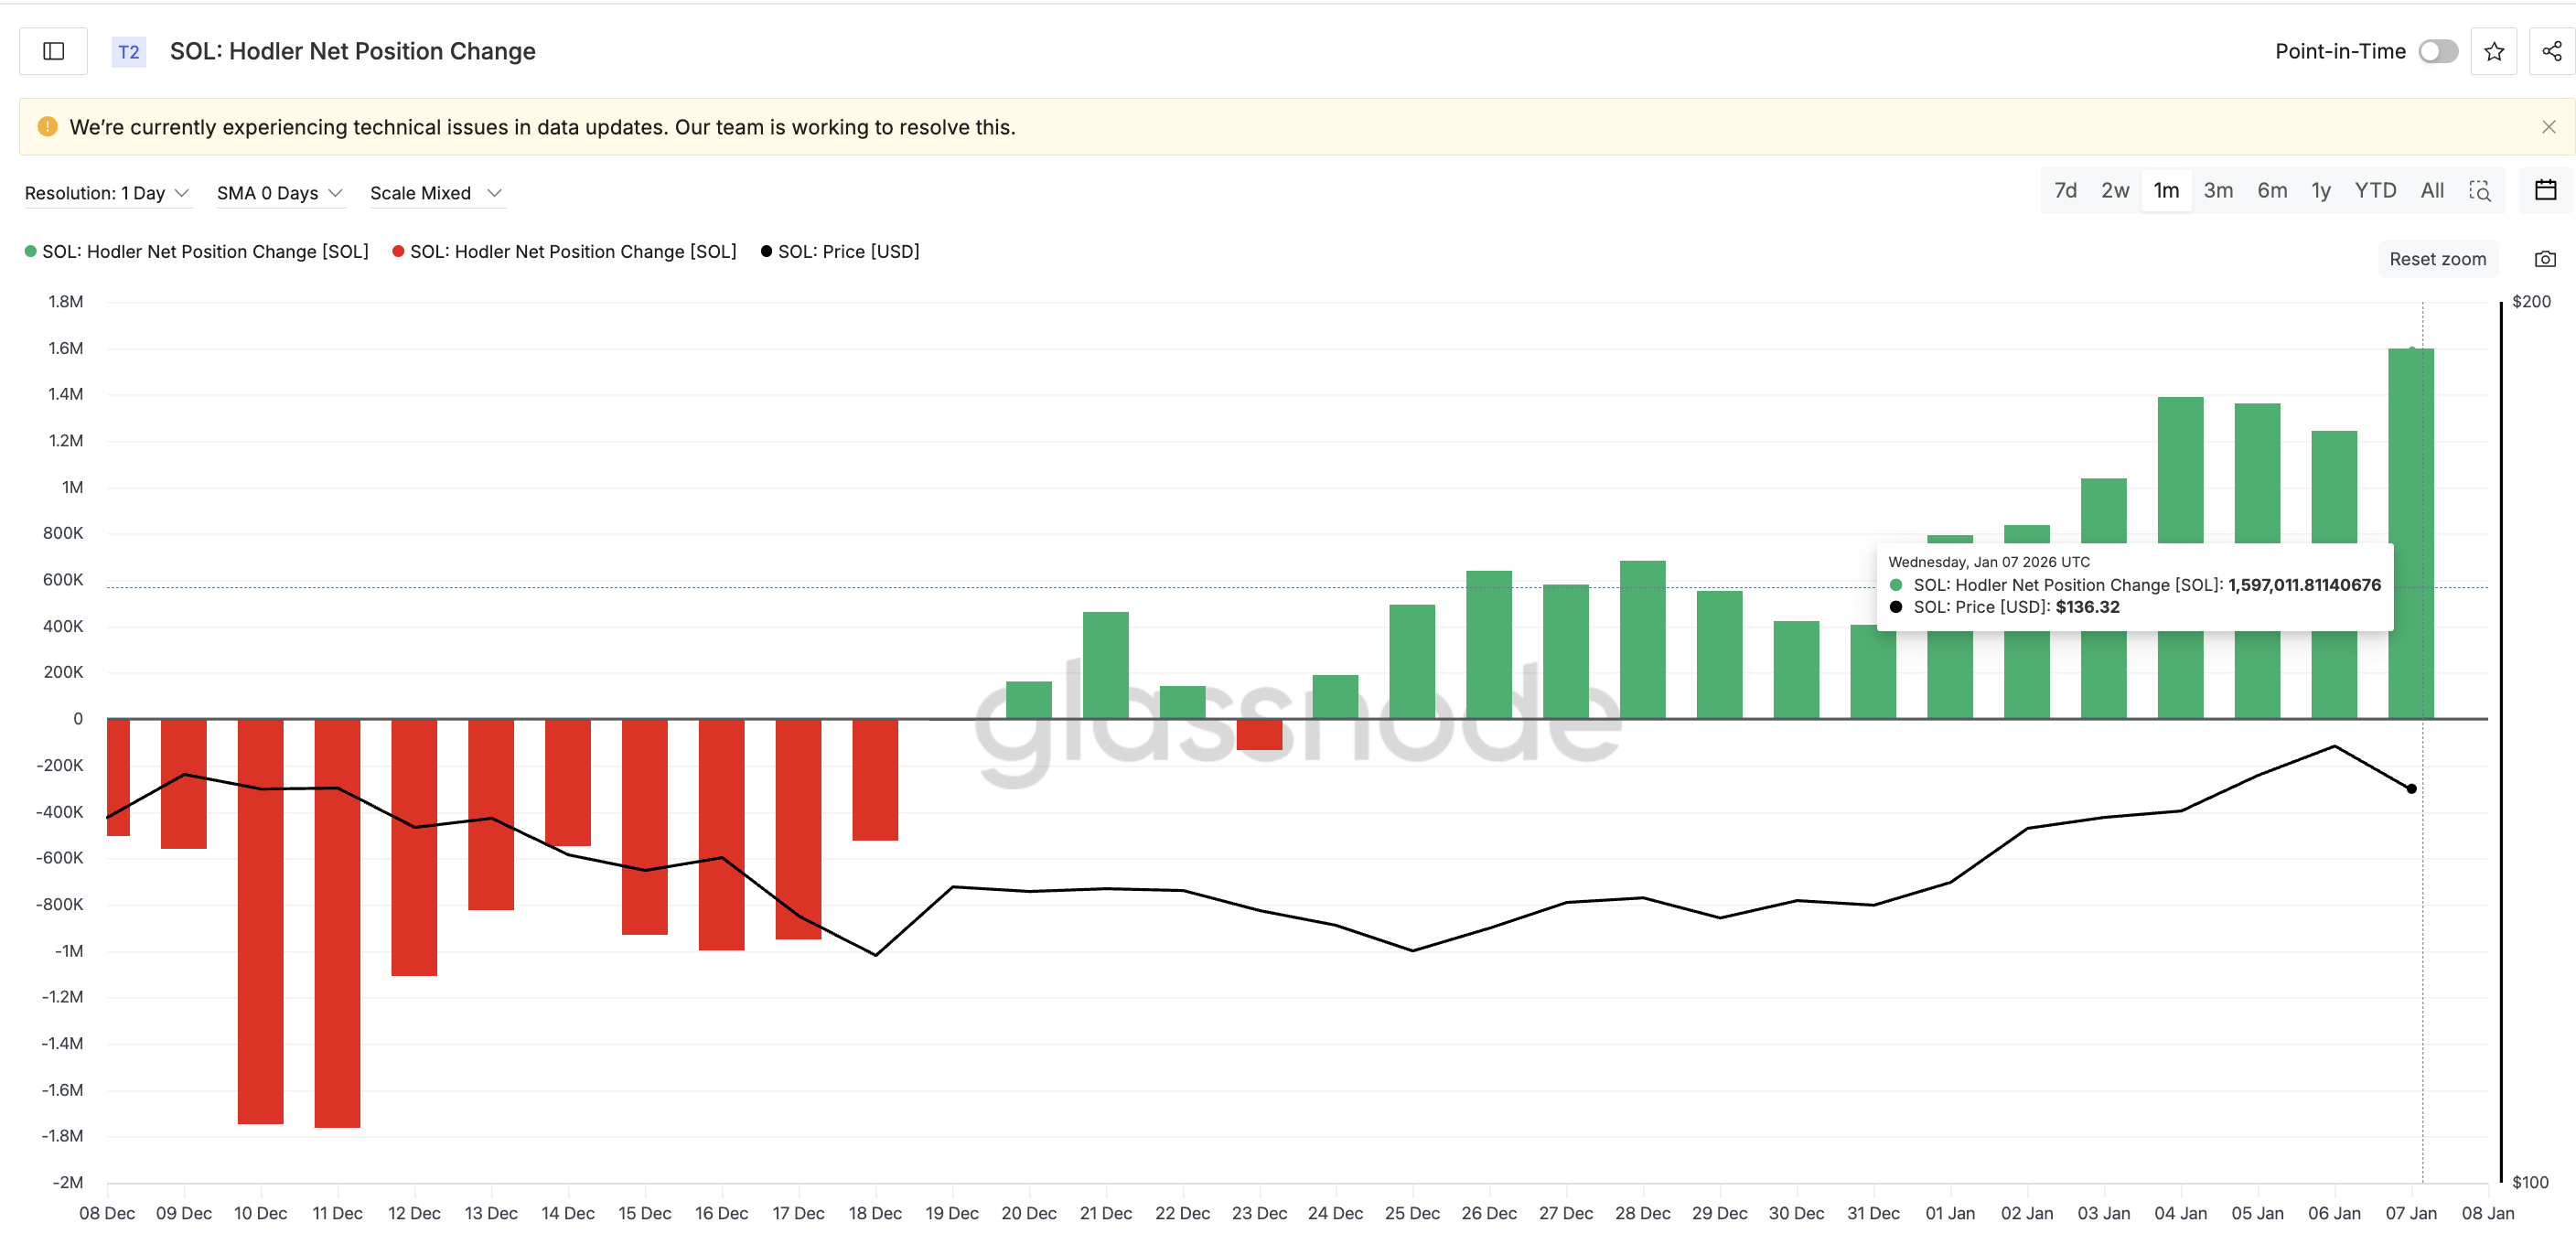
This surge explains why Solana has avoided a deeper pullback despite visible profit-taking from short-term traders. It also lines up with the steady rise in CMF, confirming that capital is flowing in, not out.
From here, price levels define the next phase. Solana needs to hold above $133 to keep the structure stable. Pullbacks toward $130 still fit the right-shoulder formation. Even a move toward $121 would not invalidate the pattern.
For upside confirmation, Solana must reclaim $143. A daily close above that level would confirm the breakout and activate the path toward $178.

With speculative supply declining, buying pressure surging, and capital flow staying positive, Solana’s pullback continues to look healthy. The next move depends on whether the SOL price can convert that positioning into a neckline break.


Kommentar hinterlassen