


The Bitcoin price is under renewed pressure. BTC is down about 4% over the past 24 hours and nearly 10% over the past 30 days, as selling pressure builds across the crypto market. While traders debate rebound versus breakdown, a critical long-term level has now surfaced that could decide how Bitcoin ends the year.
Both price structure and cycle analysis are converging around the same zone. If Bitcoin fails to defend it before the year closes, downside risks increase sharply.
Sponsored
A Make-or-Break Bitcoin Price Level Comes Into Focus
Bitcoin is currently trading close to the 2-Year Simple Moving Average (2Y SMA), which sits near $82,800. This level is not just another support. It is one of Bitcoin’s most important long-term cycle markers.
The 2Y SMA is calculated using daily closes, but it is interpreted on a monthly closing basis for cycle analysis. What matters is not intraday price action, but where Bitcoin closes the month.
Want more token insights like this? Sign up for Editor Harsh Notariya’s Daily Crypto Newsletter here.

Last time when the Bitcoin price dropped under this SMA line in mid-2022, it corrected an additional 51% before attempting an upmove. That is why December 31 matters.
When the December monthly candle closes, the market locks in a full month of data. That candle becomes the official signal used by analysts to judge whether Bitcoin is holding a long-term trend or entering deeper structural weakness.
Sponsored

Historically, monthly closes below the 2Y SMA have marked extended bearish phases. Monthly defenses or reclaims above it have signaled cycle survival. Once the month closes, there might be no second chance.
Analysts tracking long-term Bitcoin cycles have flagged this same level as a structural line in the sand. The key takeaway is simple: Bitcoin needs to stay above this zone into month-end to avoid printing a confirmed breakdown signal.
Why This Support Is Under Pressure Right Now
The problem is not just technical. On-chain data shows growing stress beneath the surface.
Sponsored
Long-term holders, defined as wallets holding Bitcoin for more than 155 days, have been increasing their selling activity throughout December. According to long-term holder net position change data, net outflows rose from roughly 116,000 BTC earlier in the month to nearly 269,000 BTC by December 15.

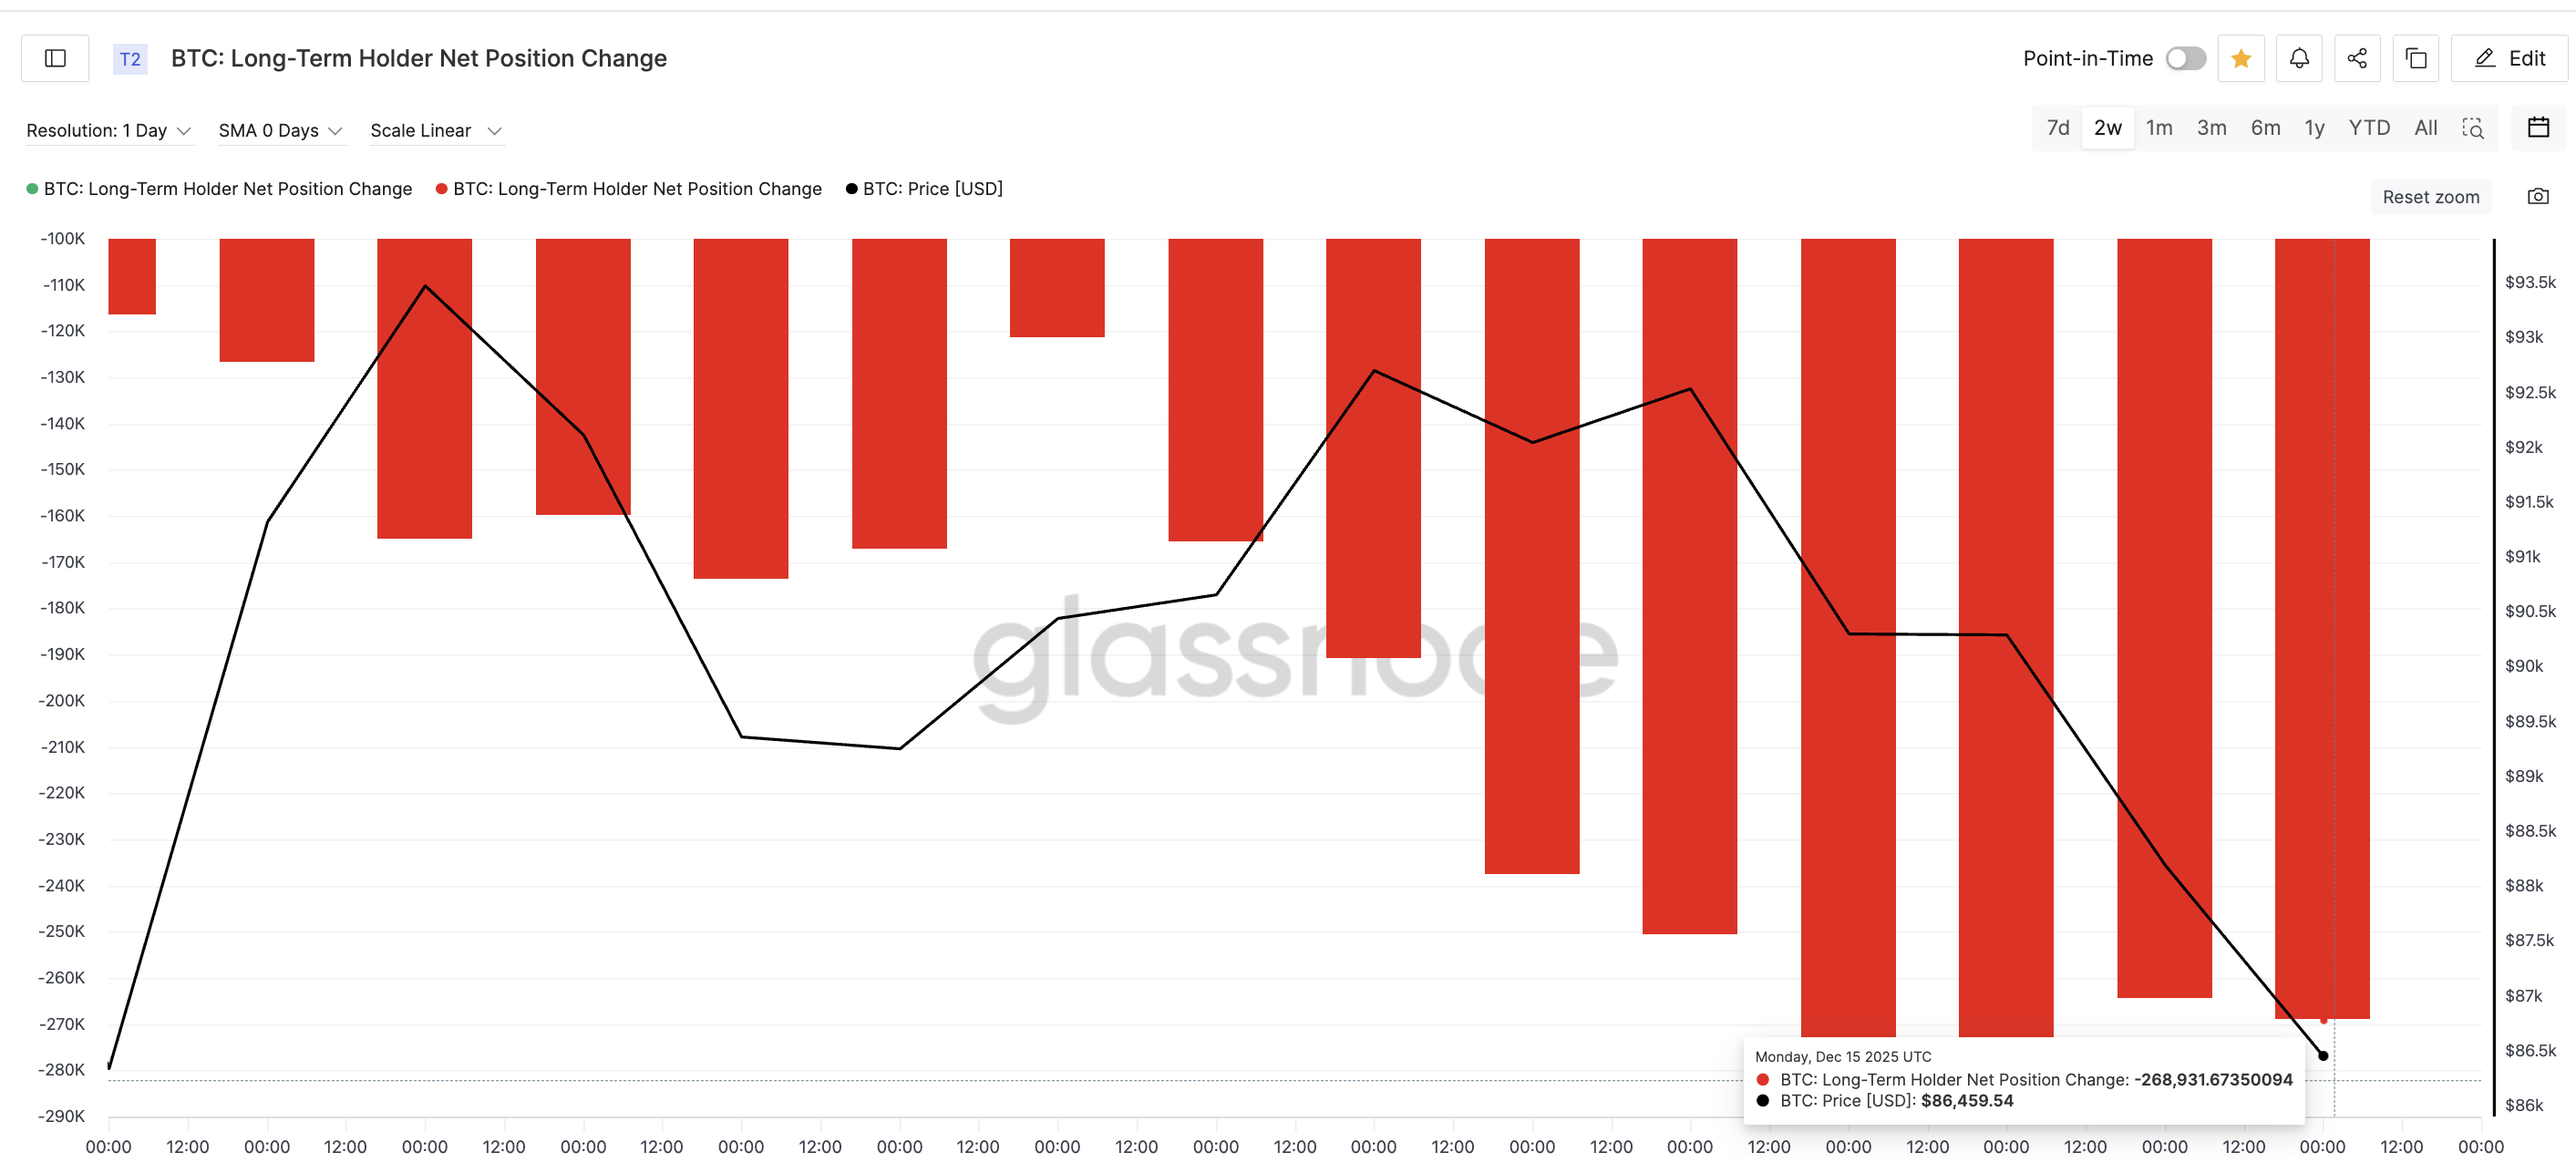
That is an increase in selling pressure of over 130% in just two weeks.
These are not short-term traders. This group typically sells only during periods of conviction or risk reduction. Their continued distribution adds weight to the downside and makes defending key support levels harder.
When long-term holders sell into weakness, it reduces the margin for error around critical price zones like the 2-year SMA.
Sponsored
Bitcoin Price Levels That Define Rebound or Breakdown
If Bitcoin fails to hold the $82,800–$81,100 region into the December close, downside risks expand quickly.
A confirmed break below this zone opens the door toward $73,300, which sits roughly 15% lower than the current level and sets the next major downside projection on the chart.

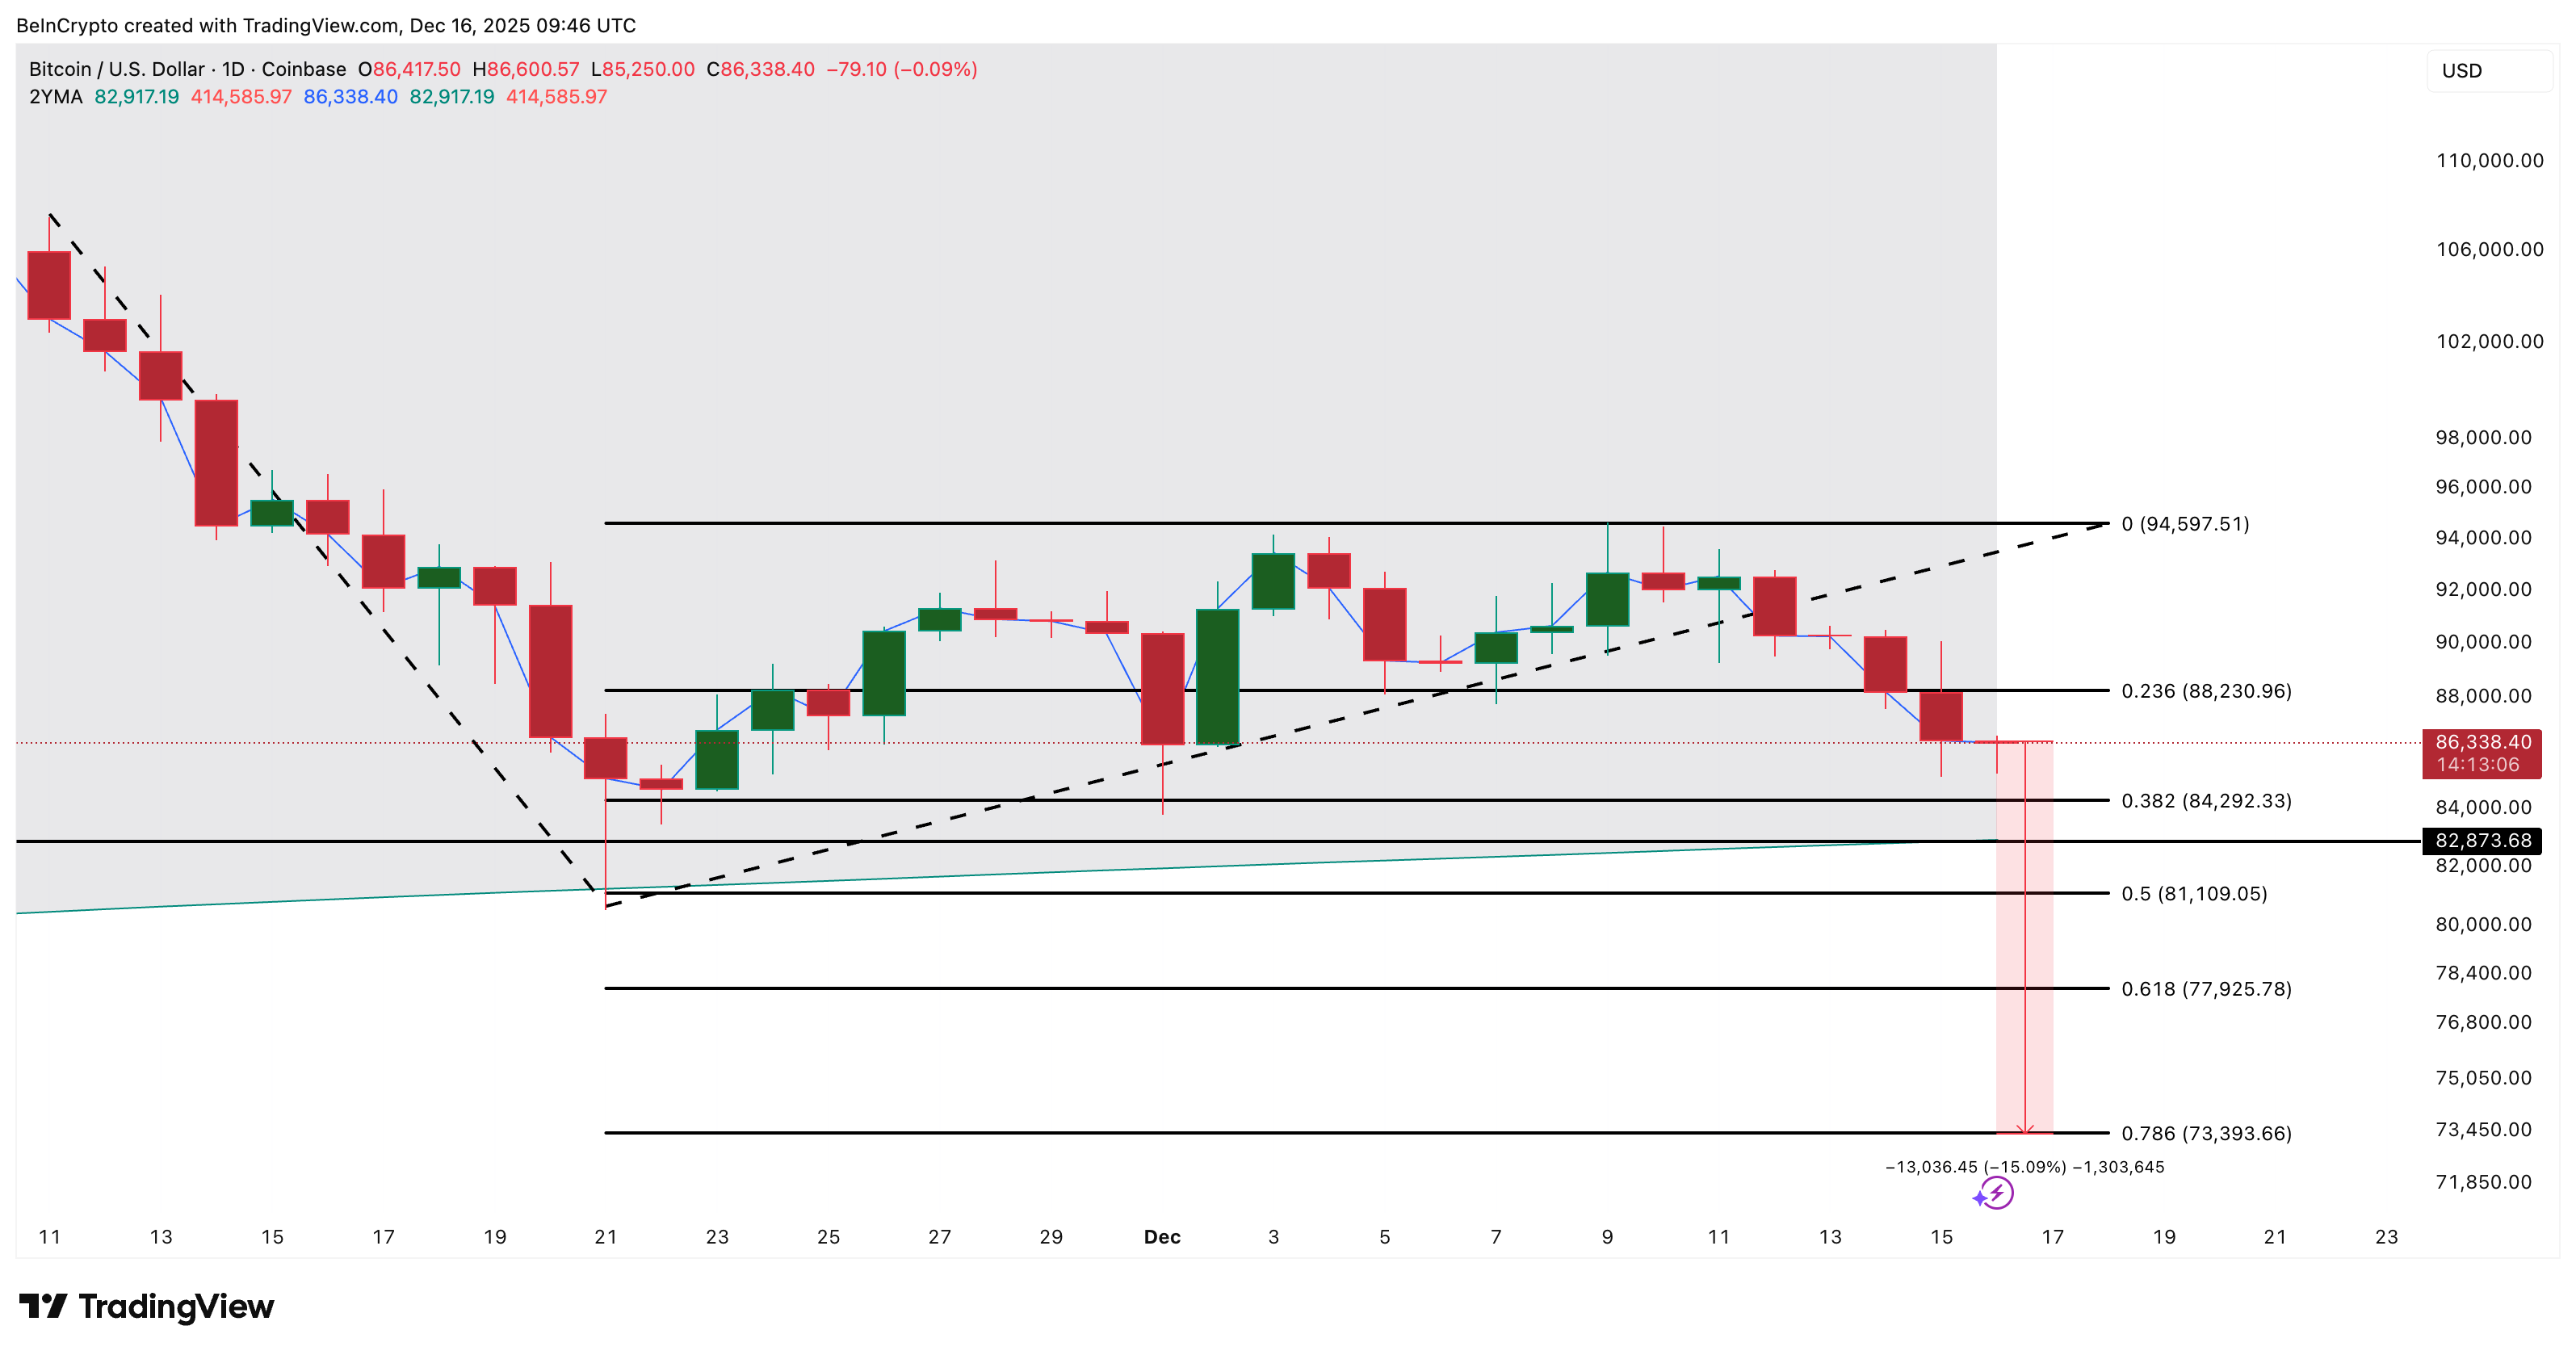
On the upside, Bitcoin must reclaim $88,200 to reduce immediate pressure. A sustained move above $94,500 would be needed to restore bullish structure and shift momentum back in favor of buyers.
Until then, Bitcoin remains trapped between long-term cycle support and rising selling pressure.


Kommentar hinterlassen