


Ethereum (ETH) is still struggling below the $2,000 mark after briefly hitting the threshold following the recent FOMC meeting. The bullish momentum has quickly faded, and ETH is again showing signs of weakness.
Technical indicators, including RSI and DMI, indicate increasing bearish pressure in the short term. Traders are now monitoring key support and resistance levels to see whether ETH will continue its correction or attempt a recovery.
Ethereum RSI Is Down After Touching Overbought Levels
Ethereum’s RSI has dropped sharply to 46.63 from 71 just two days ago, signaling a shift in momentum.
The Relative Strength Index (RSI) is a momentum oscillator that measures the speed and change of price movements, typically on a scale of 0 to 100. Readings above 70 suggest an asset is overbought, while levels below 30 indicate it may be oversold.

With ETH’s RSI now sitting near 46, it has entered neutral territory, showing that the recent bullish momentum has faded. This could imply a period of consolidation or further downside risk if sellers maintain control.
Traders may now expect ETH to stabilize and bounce if demand returns or continue its correction if bearish pressure grows stronger.
ETH DMI Shows Sellers Are Again In Control
Ethereum’s DMI chart shows that the ADX has dropped to 17.96 from 24.5 yesterday, indicating weakening trend strength.
The Average Directional Index (ADX) measures the strength of a trend, with values above 25 suggesting a strong trend and values below 20 pointing to a weak or ranging market.

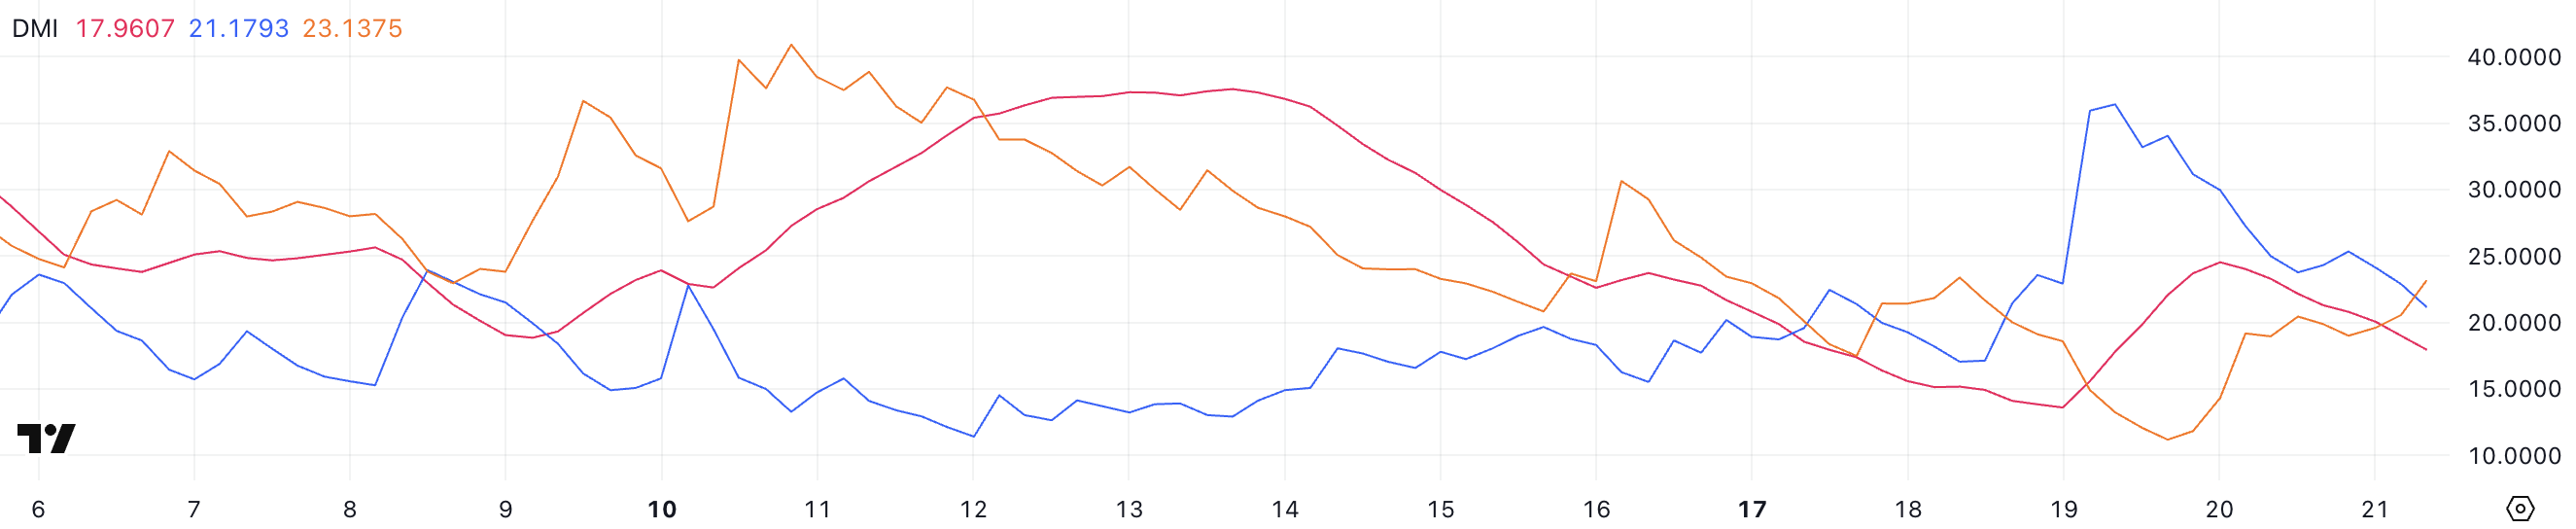
At the same time, ETH’s +DI has fallen to 21.17 from 34, signaling that bullish momentum is fading. Meanwhile, the -DI has climbed to 23.12 from 11.17, suggesting growing bearish pressure.
With ADX dropping and -DI crossing above +DI, Ethereum could face further downside or enter a consolidation phase as sellers gain more influence over price action.
Can Ethereum Surge 30% Soon?
Ethereum price is currently in a corrective phase, and if this trend continues, it could test key support levels at $1,867 and $1,823.
A break below these zones could open the door for a deeper decline toward $1,759, with the risk of ETH falling below $1,700 for the first time since October 2023.

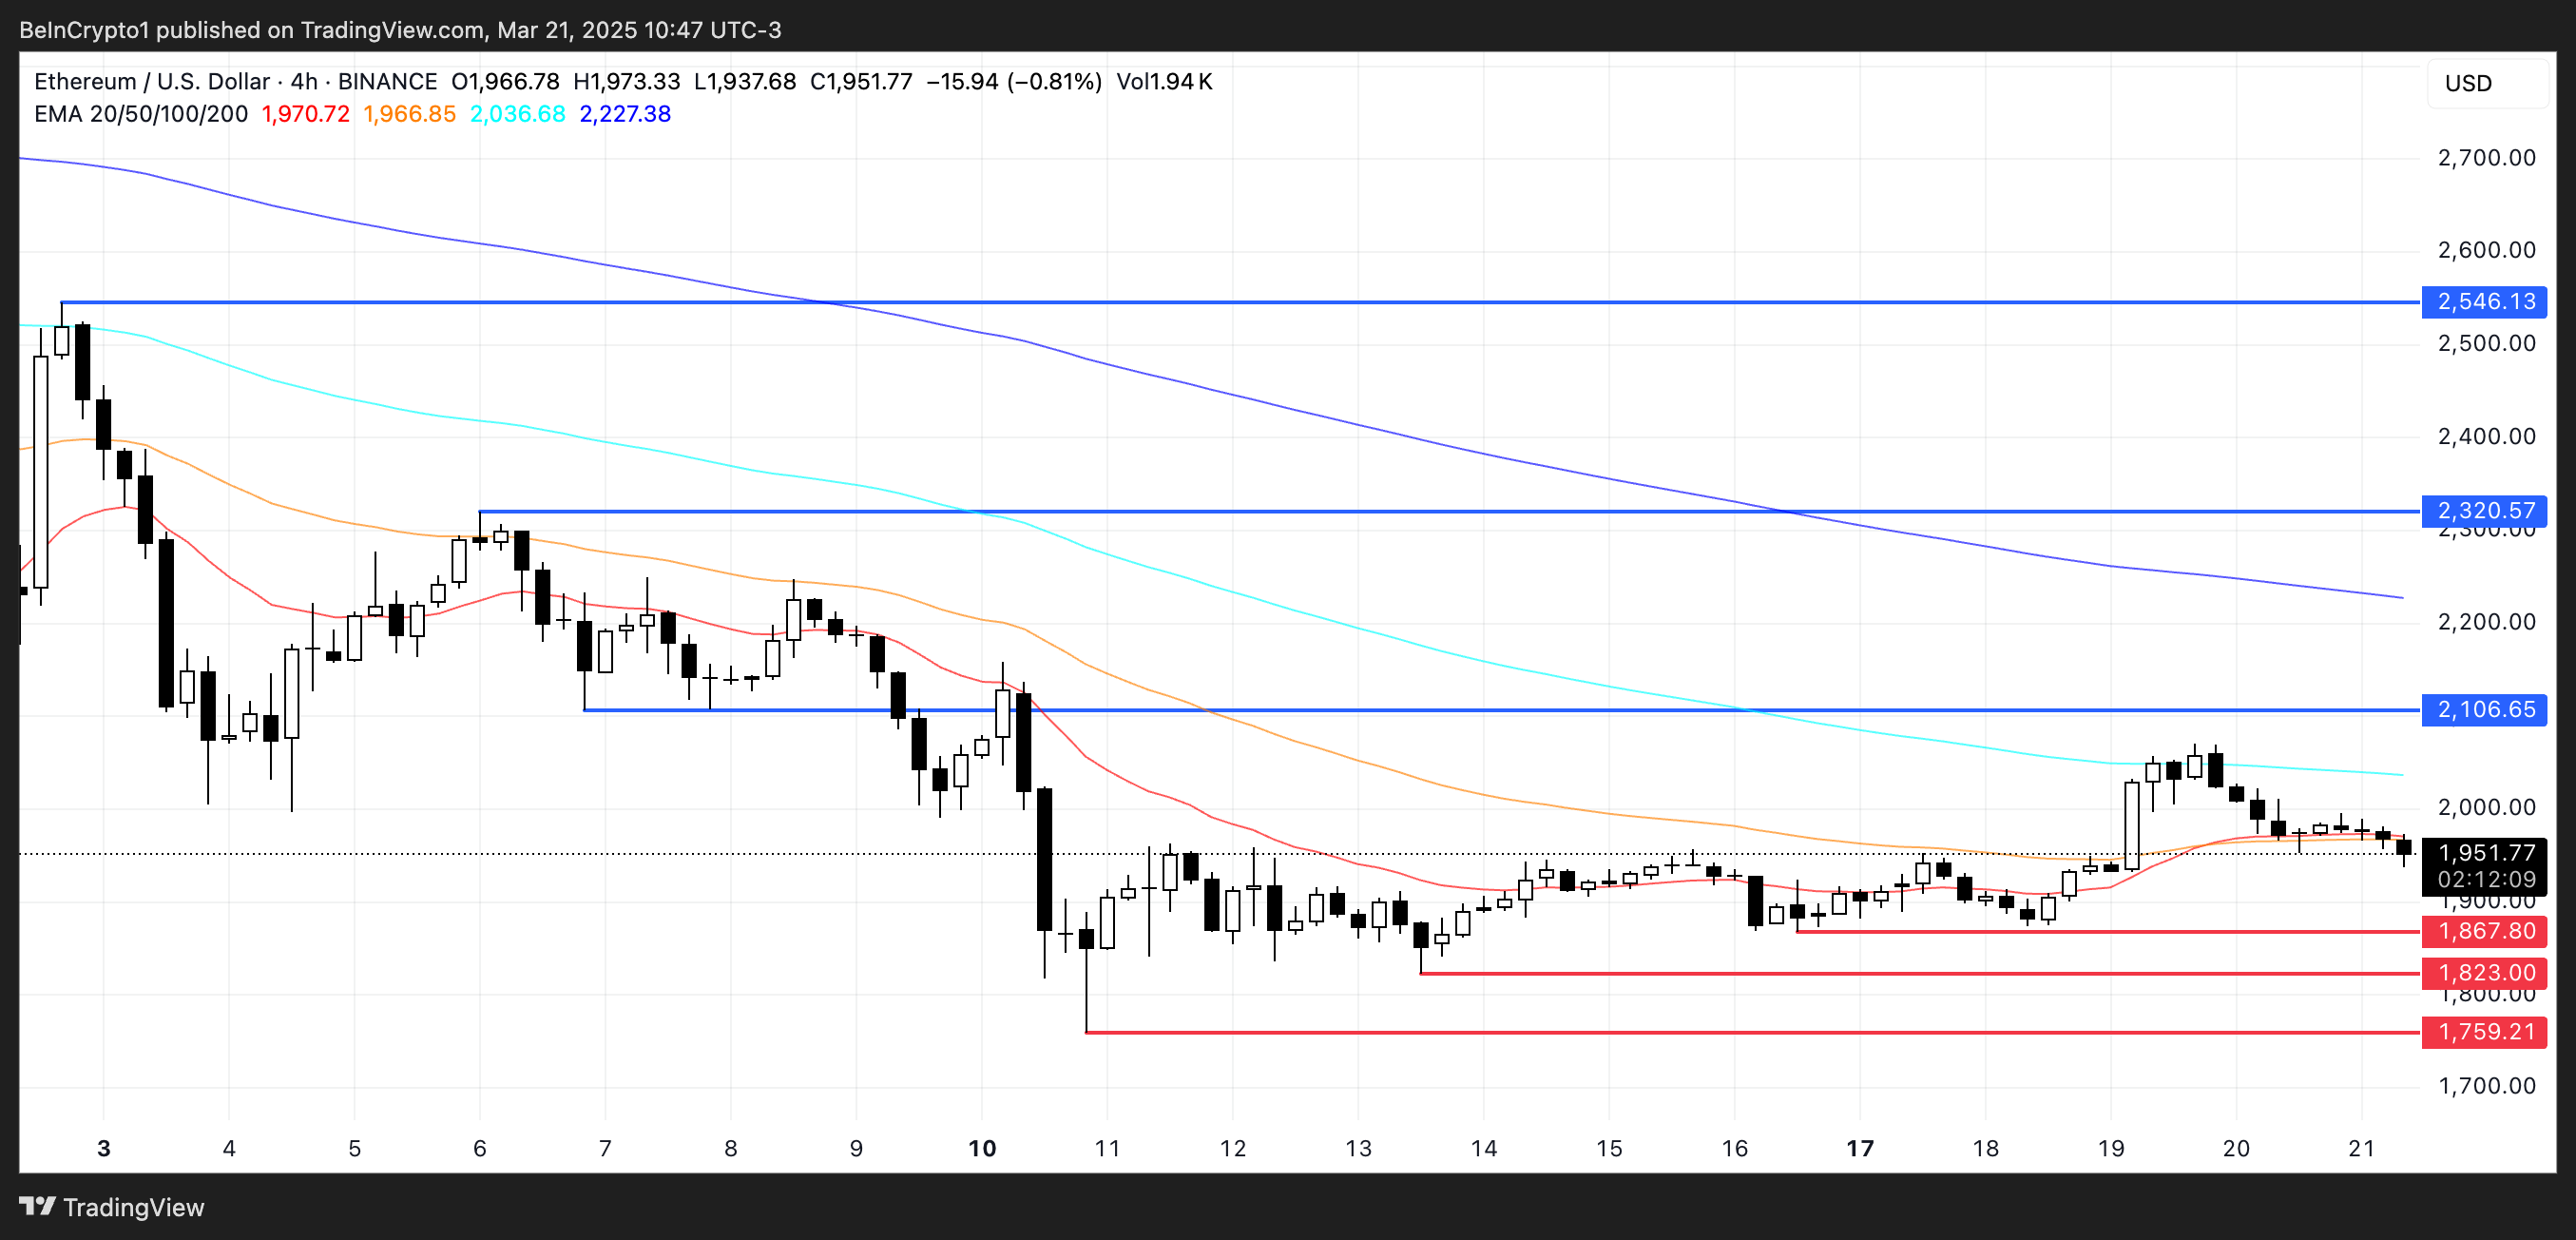
However, if Ethereum manages to reverse the current downtrend and regain bullish momentum, it could push toward resistance at $2,106.
A stronger rally could see ETH aiming for $2,320 and even $2,546, offering a potential upside of around 30% from current levels.
Disclaimer
In line with the Trust Project guidelines, this price analysis article is for informational purposes only and should not be considered financial or investment advice. BeInCrypto is committed to accurate, unbiased reporting, but market conditions are subject to change without notice. Always conduct your own research and consult with a professional before making any financial decisions. Please note that our Terms and Conditions, Privacy Policy, and Disclaimers have been updated.


Kommentar hinterlassen