


Layer-1 (L1) coin KAVA emerged as the market’s top gainer on Friday, defying the broader downturn to post gains over the past 24 hours. While most cryptocurrencies have struggled within a narrow range in recent weeks, KAVA has surged, setting itself apart from the pack.
Now trading at a 30-day high, the altcoin shows strong bullish momentum and could be gearing up for even more upside.
KAVA Defies Market Downtrend, Surges to 30-Day High
KAVA is up 7% over the past day. It trades at a 30-day high of $0.55, bucking the general market decline to record 21% gains over the past month. With a strengthening bullish bias, the L1 coin eyes more gains.
On the KAVA/USD one-day chart, the coin’s Aroon Up Line is at 100%, confirming the strength of its current uptrend.

The indicator measures the strength of an asset’s price trends. It consists of two lines: Aroon Up, which tracks the time since the highest high, and Aroon Down, which tracks the time since the lowest low.
When the Aroon Up line is at 100% or near it, the asset has recently hit a new high and is in a strong uptrend. This is true of KAVA, which trades at its highest price in 30 days. It reflects the strong bullish momentum in the coin’s spot markets, indicating that buyers are in control and its price may continue rising.
Further, the coin’s Moving Average Convergence Divergence (MACD) setup confirms this bullish outlook. At press time, KAVA’s MACD line (blue) rests above its signal line (orange).

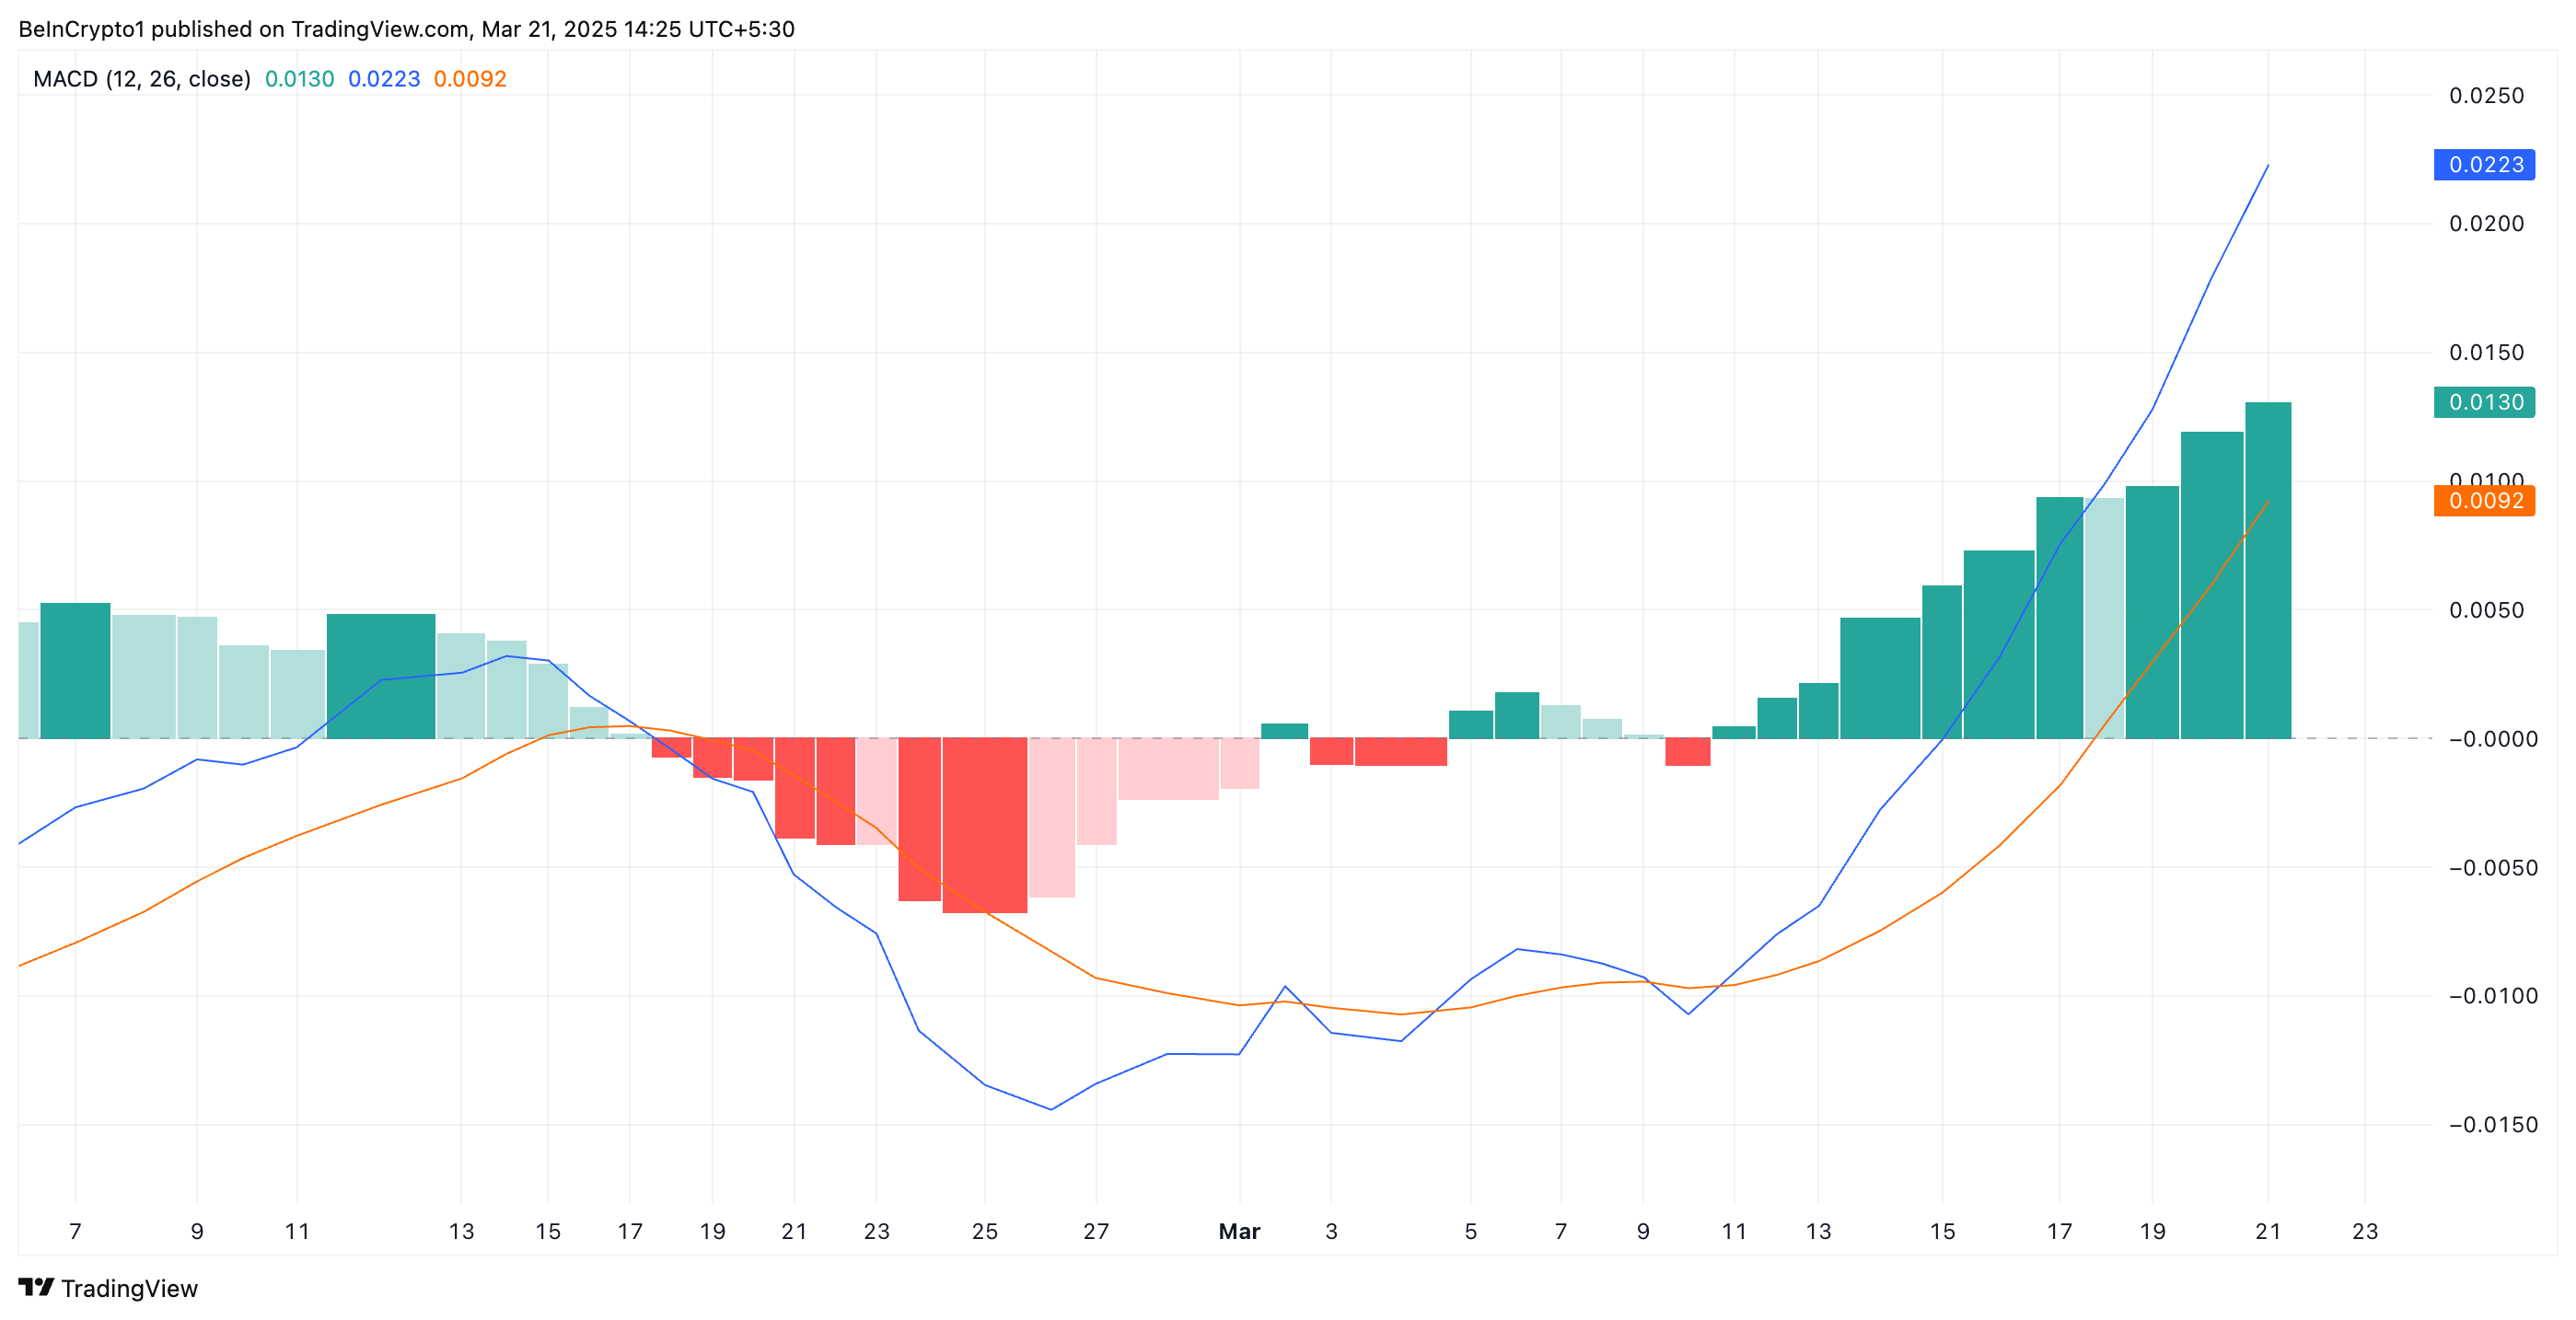
The MACD indicator measures the strength and direction of an asset’s momentum. It helps traders identify potential trend reversals and momentum shifts.
When the MACD line is above the signal line, it is a bullish signal, often interpreted by traders as a buy signal.
KAVA’s Uptrend Remains Intact, Eyeing a Three-Month High at $0.74
KAVA has traded within an ascending parallel channel since March 10. This bullish pattern is formed when an asset’s price moves between two upward-sloping parallel trendlines, indicating a sustained uptrend.
It signals consistent higher highs and higher lows, showing strong bullish pressure as KAVA buyers dominate the market. If this continues, the coin’s price could break past resistance at $0.58 and climb toward a three-month high of $0.74.

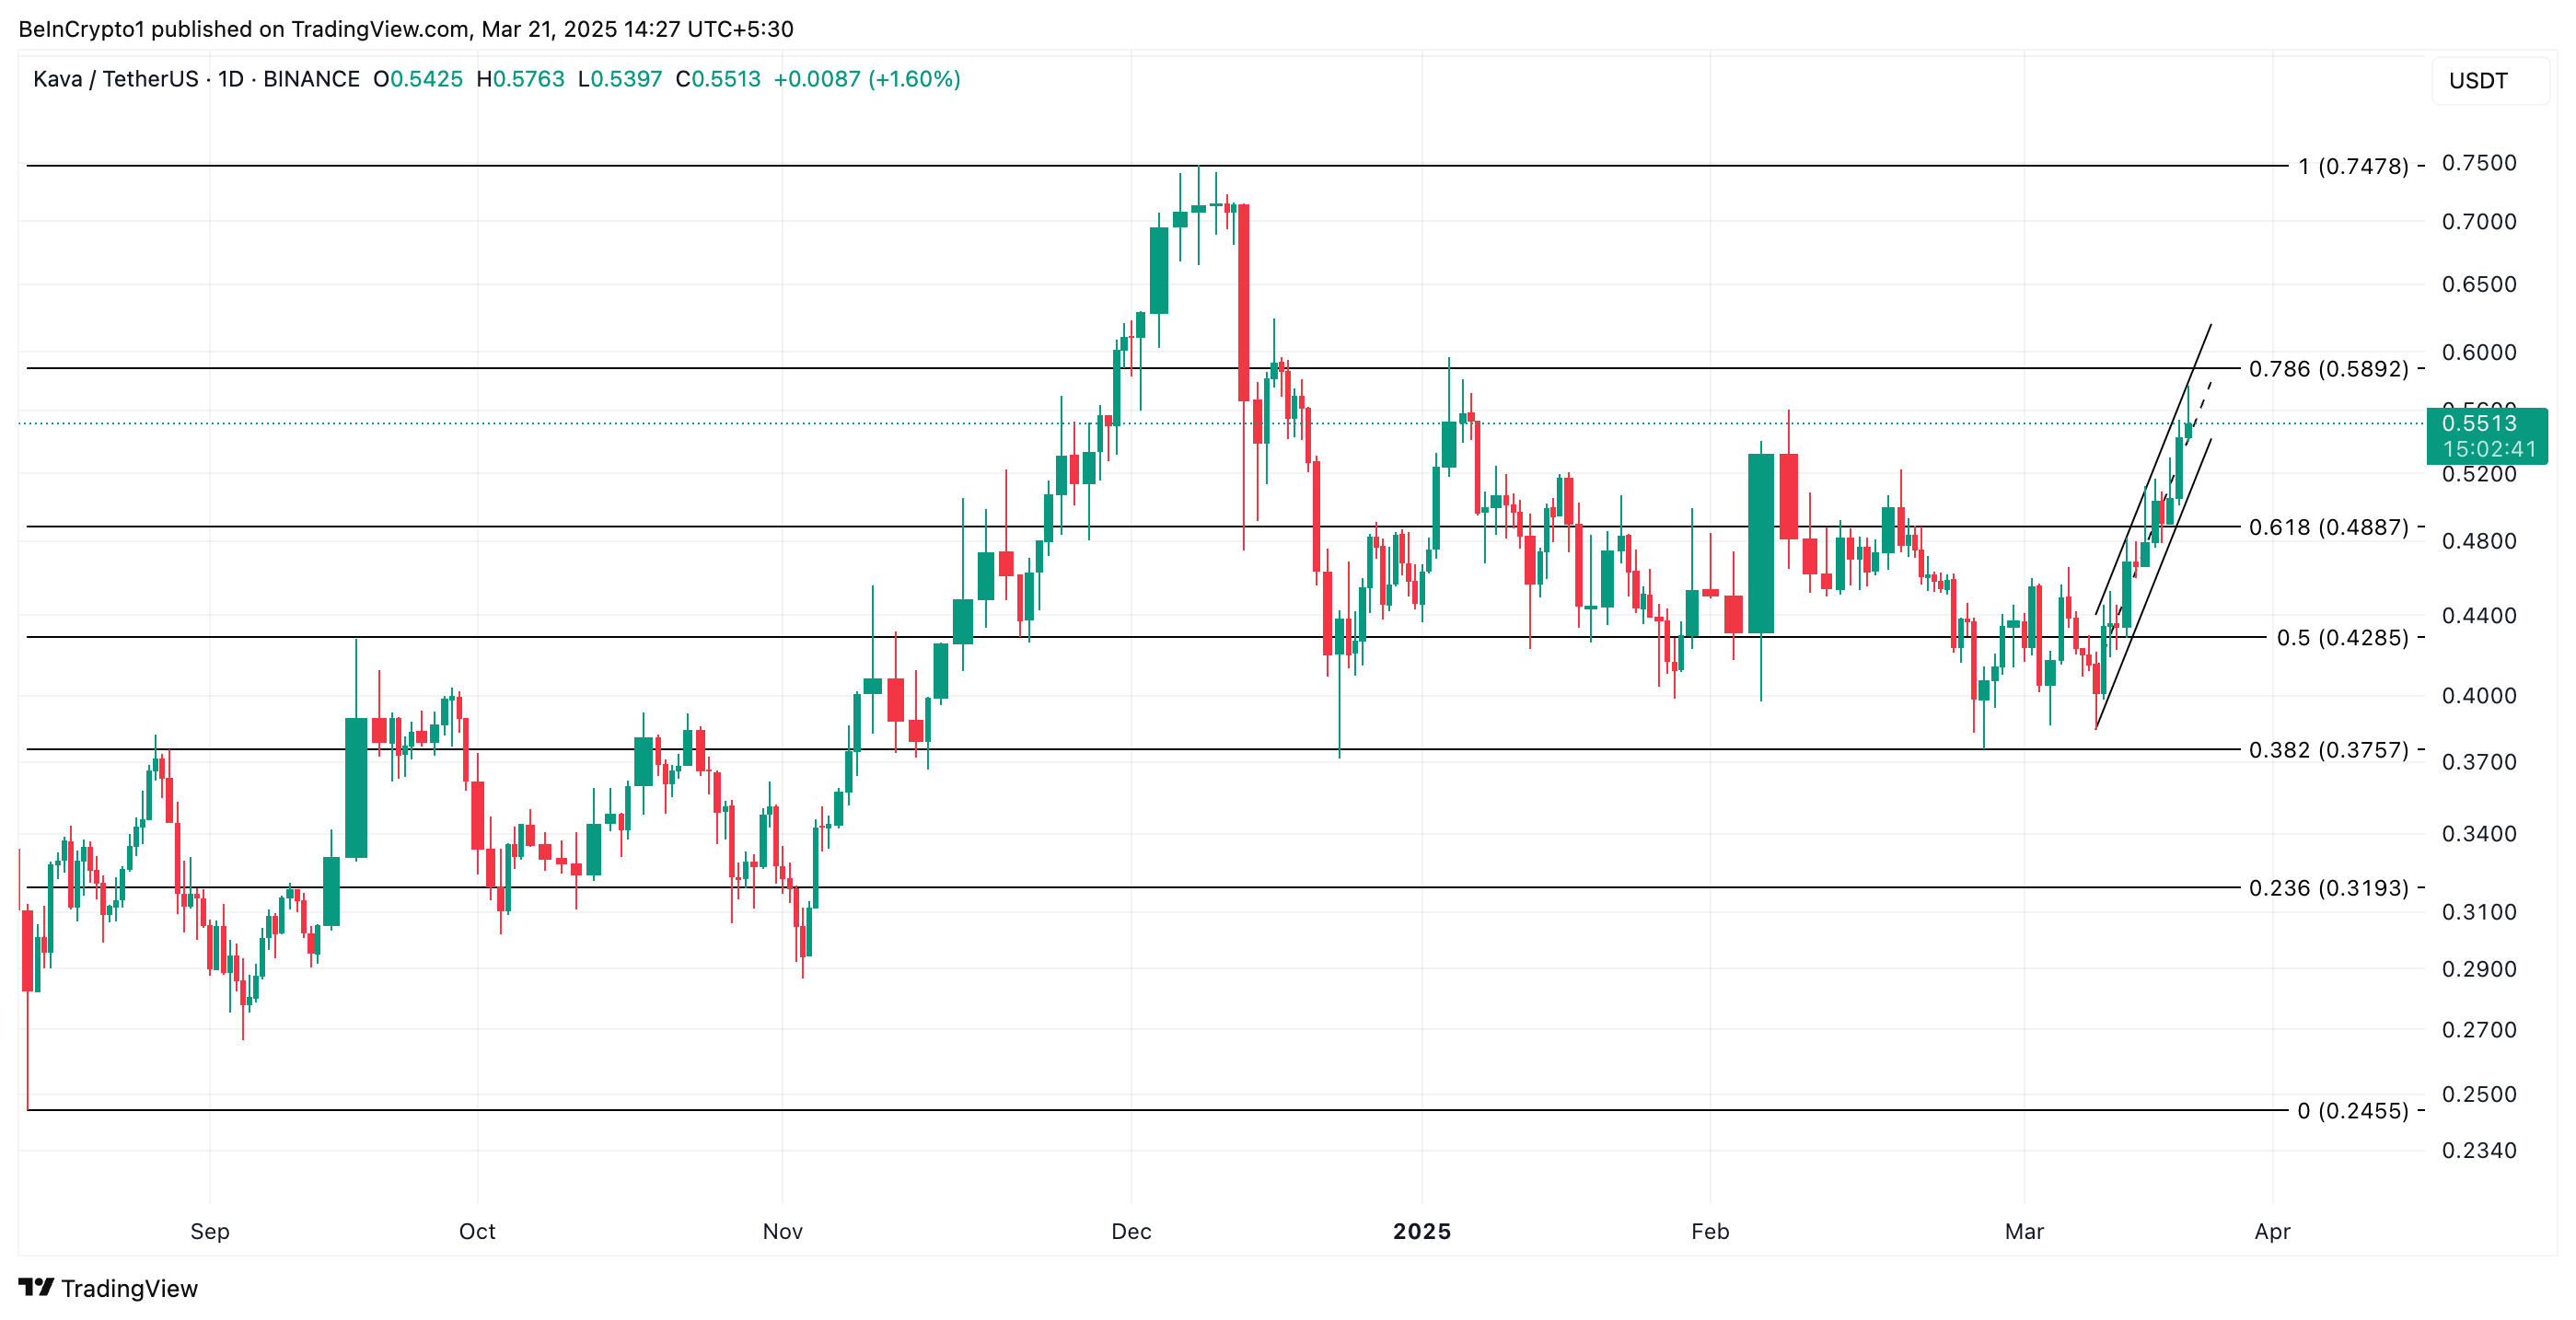
On the other hand, if buying activity weakens, KAVA could shed its recent gains and fall to $0.48.
Disclaimer
In line with the Trust Project guidelines, this price analysis article is for informational purposes only and should not be considered financial or investment advice. BeInCrypto is committed to accurate, unbiased reporting, but market conditions are subject to change without notice. Always conduct your own research and consult with a professional before making any financial decisions. Please note that our Terms and Conditions, Privacy Policy, and Disclaimers have been updated.


Kommentar hinterlassen