


Berachain (BERA) is down almost 15% in the last 24 hours, with its market cap now at $778 million, although its price remains up nearly 20% over the past seven days. This sharp pullback comes after a strong rally between February 18 and February 20, when BERA reached levels above $8.5.
BERA’s Relative Strength Index (RSI) has dropped from overbought levels, signaling a loss of bullish momentum, while its Directional Movement Index (DMI) shows growing bearish pressure. As BERA navigates this correction phase, it faces key support at $6.1, with potential resistance levels at $8.5, $9.1, and $10 if bullish momentum returns.
BERA RSI Is Dropping Steadily After Touching Overbought Levels
Berachain Relative Strength Index (RSI) is currently at 50.6, down sharply from 86.7 just two days ago when its price surged above $8.5. RSI is a momentum oscillator that measures the speed and change of price movements, ranging from 0 to 100.
It is commonly used to identify overbought or oversold conditions, with values above 70 indicating overbought levels and below 30 suggesting oversold territory.
The steep decline in BERA’s RSI reflects a significant loss of bullish momentum after reaching overbought levels above 86, where a correction was likely.

With RSI now at 50.6, BERA is in a neutral zone, suggesting that buying and selling pressures are relatively balanced.
This could indicate a period of consolidation as the market digests recent gains. If RSI continues to decline below 50, it could signal increasing bearish momentum. This could lead to a further price drop for BERA.
Conversely, if RSI stabilizes and begins to rise, it could suggest renewed buying interest and a potential recovery in Berachain price.
BERA DMI Chart Shows Buyers Are Losing Control
Berachain Directional Movement Index (DMI) chart shows its Average Directional Index (ADX) currently at 50.5, after peaking at 60.2 yesterday, up from just 13.3 five days ago. ADX is an indicator used to measure the strength of a trend, regardless of its direction, ranging from 0 to 100.
Values above 25 typically indicate a strong trend, while values below 20 suggest a weak or sideways market. The sharp rise in ADX reflects a significant increase in trend strength, confirming that BERA has been experiencing strong directional movement recently.

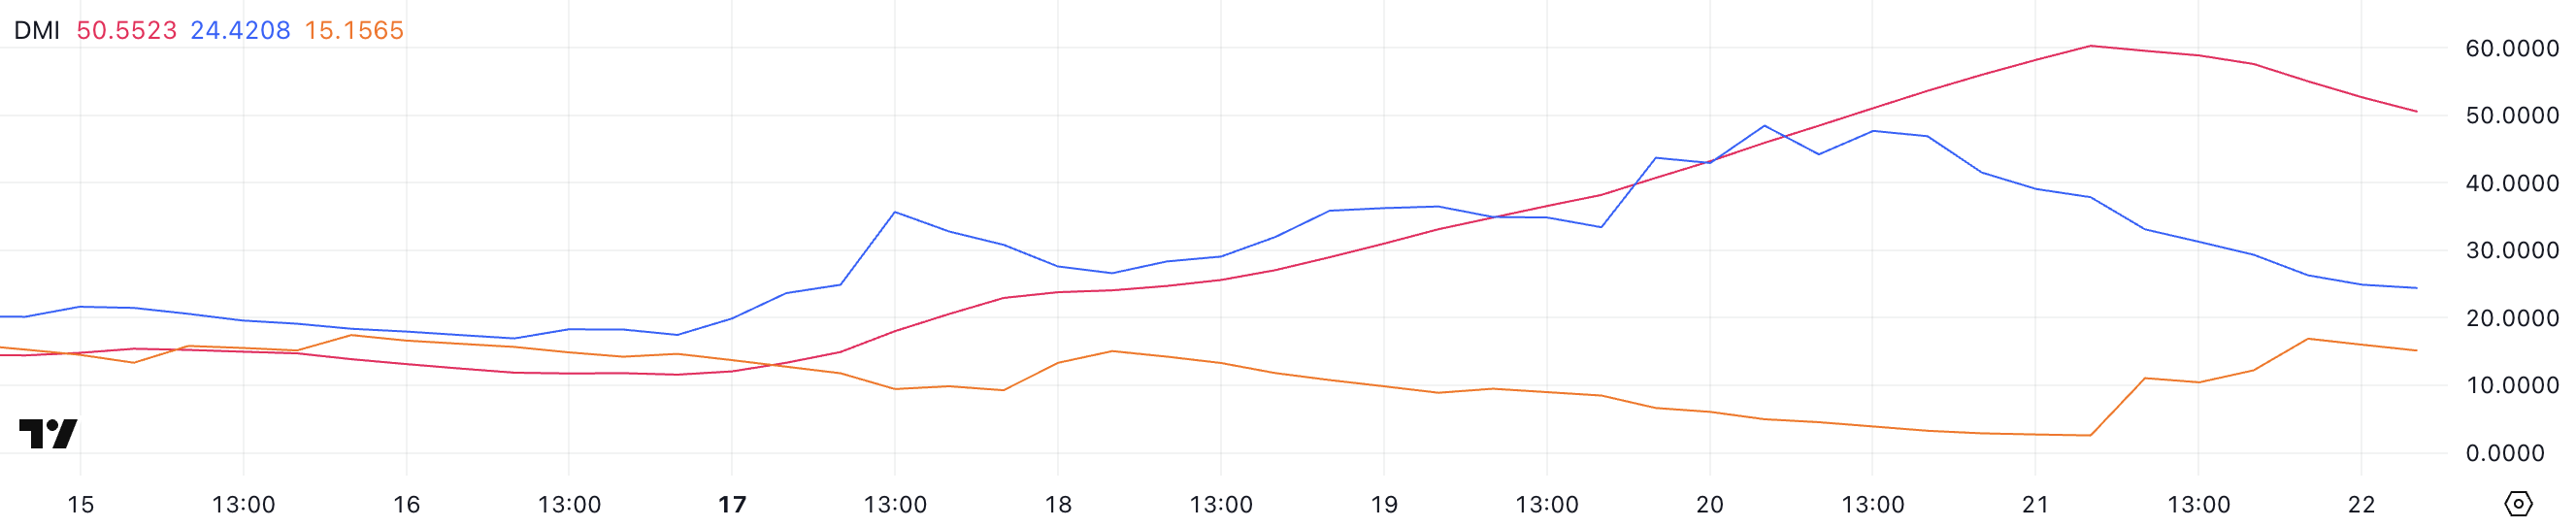
Meanwhile, BERA’s +DI is at 24.4, down from 48.4 two days ago, indicating weakening bullish momentum. Meanwhile, -DI has risen to 15.1 from 4.9, suggesting growing bearish pressure.
This shift signals that the bullish trend that drove prices higher is losing steam, and selling interest is beginning to increase.
If -DI continues to rise above +DI, it could indicate a bearish crossover, signaling a potential reversal or deeper correction in BERA’s price. However, if +DI stabilizes and moves upward again, it could suggest a continuation of the uptrend, albeit with reduced momentum.
Will Berachain Fall Below $6 Soon?
Berachain surged 53% between February 18 and February 20, pushing its price above $8.5 after the coin struggled following its airdrop. However, after this sharp rally, BERA entered a correction phase and is currently down almost 15% in the last 24 hours.
This pullback suggests profit-taking and a shift in market sentiment as buyers hesitate to push prices higher. If the downtrend continues, BERA could soon test the support at $6.1, and a break below this level could lead to a further decline towards $5.48, reflecting increased selling pressure.

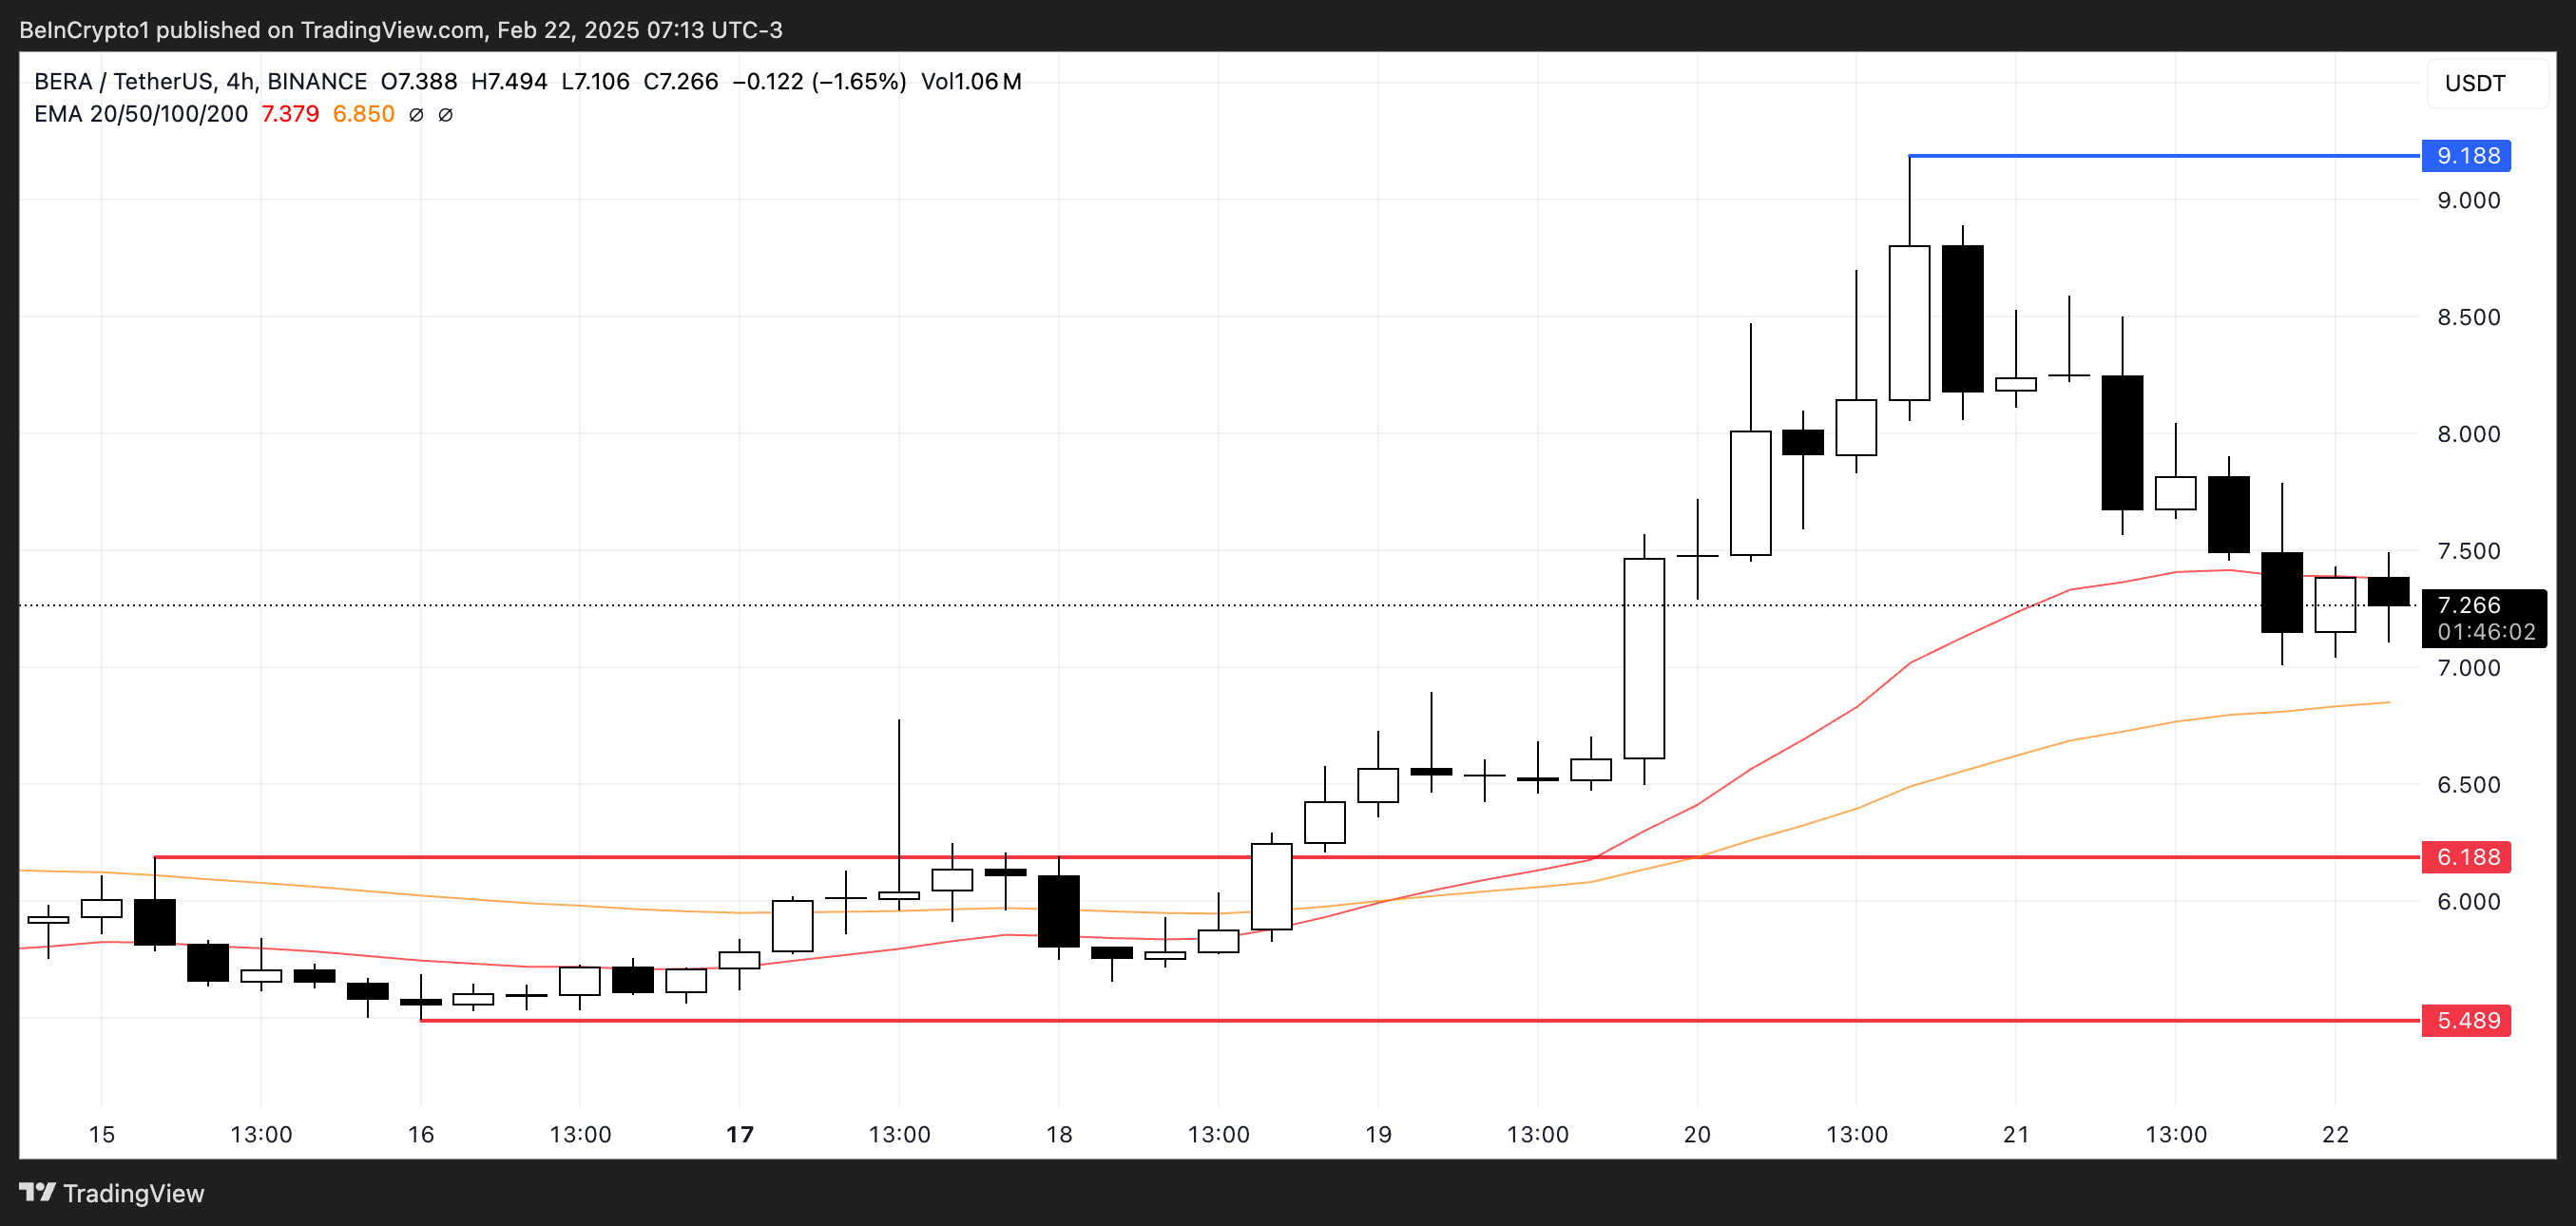
On the other hand, if Berachain can regain its bullish momentum from a few days ago, it could rise above $8.5 again, potentially testing the next resistance levels at $9.1 or even $10.
To confirm this bullish scenario, Berachain would need to see renewed buying interest and strong upward momentum. If buyers can defend key support levels and push the price above resistance zones, it could indicate the continuation of the uptrend.
Disclaimer
In line with the Trust Project guidelines, this price analysis article is for informational purposes only and should not be considered financial or investment advice. BeInCrypto is committed to accurate, unbiased reporting, but market conditions are subject to change without notice. Always conduct your own research and consult with a professional before making any financial decisions. Please note that our Terms and Conditions, Privacy Policy, and Disclaimers have been updated.


Kommentar hinterlassen