Bitcoin (BTC) hit a record high on December 17 but has since dropped below $100,000. Key indicators, such as the ADX, alongside cautious whale activity, suggest a weakening downtrend.
As BTC approaches critical resistance and support levels, its next moves could significantly influence its price direction in the coming days.
BTC ADX Shows the Downtrend Is Weakening
BTC’s ADX currently stands at 18.81, down sharply from nearly 50 just seven days ago. This decline highlights a marked weakening in the strength of Bitcoin’s ongoing downtrend.
The rapid decrease in ADX suggests that the momentum driving BTC recent price movements is fading, leaving the market in a state of reduced directional force.
The Average Directional Index (ADX) measures the strength of a trend, whether upward or downward, on a scale from 0 to 100. Values above 25 typically indicate a strong trend, while readings below 20 signify a weak or non-existent trend. With BTC’s ADX at 18.81, this low reading implies that the current downtrend may be losing momentum.
As a result, Bitcoin could enter a short-term consolidation phase characterized by reduced volatility and sideways price action.
Bitcoin Whales Started Accumulating Again
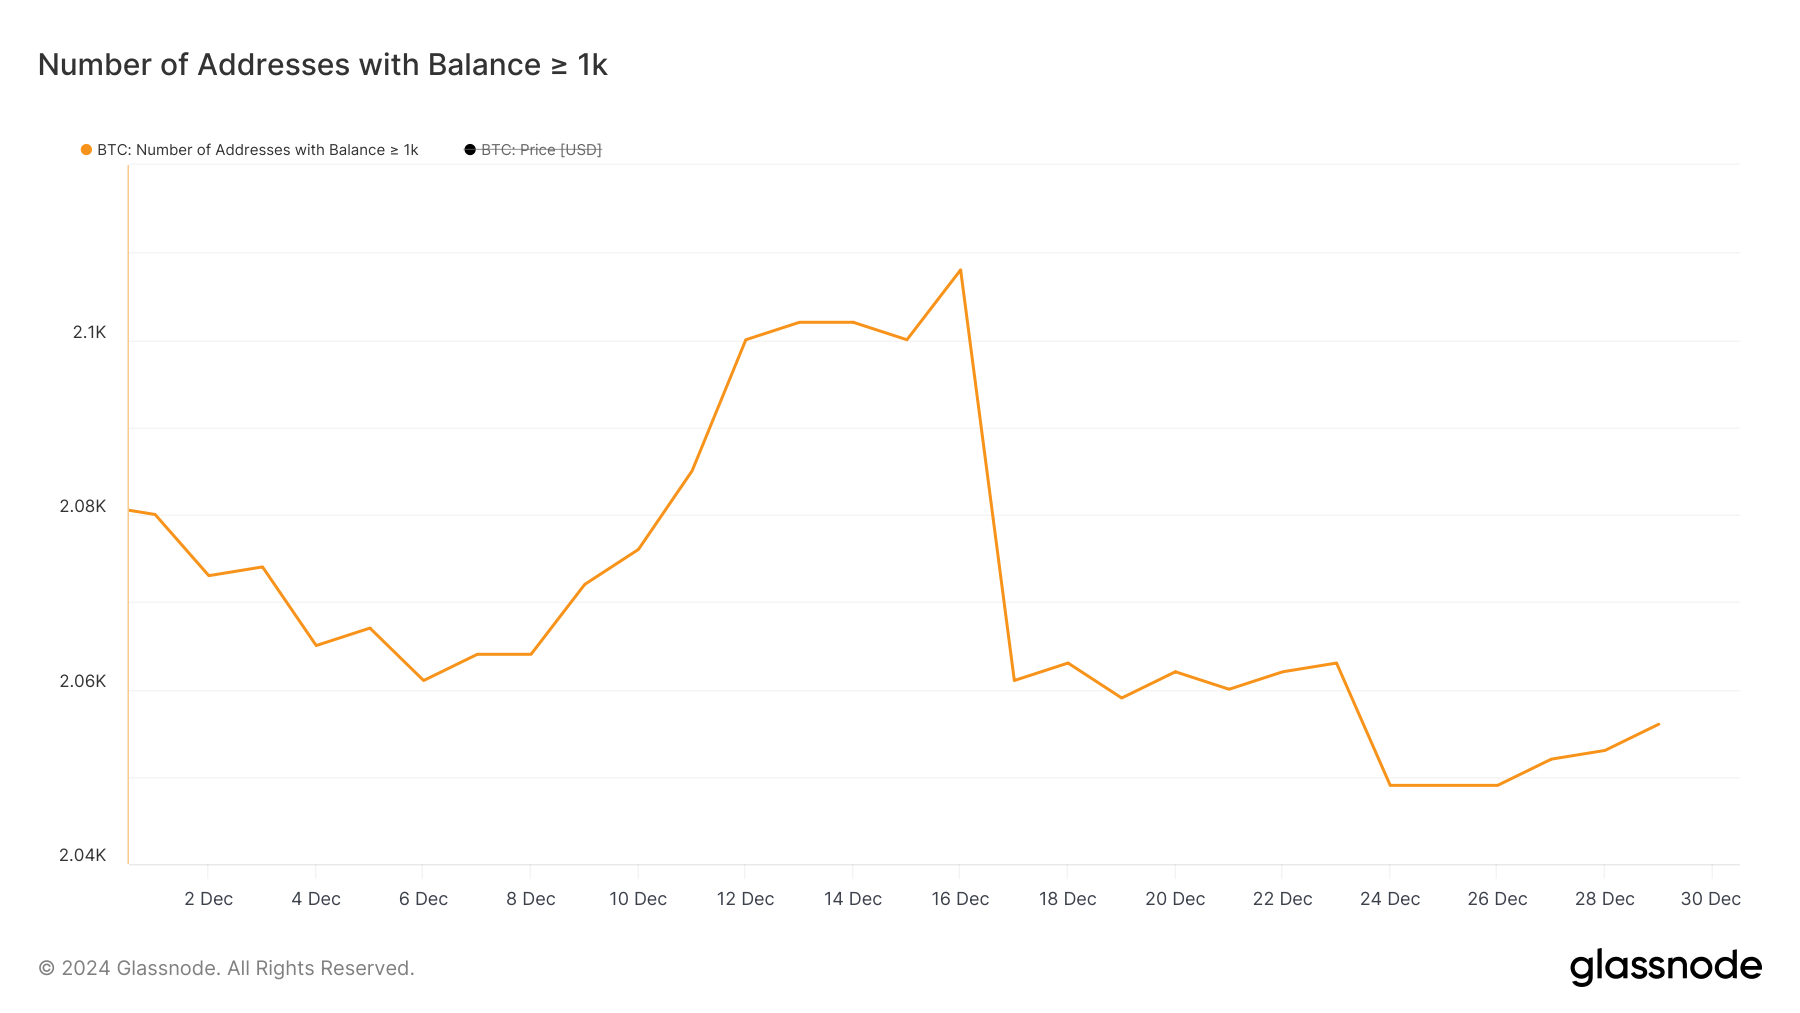
The number of Bitcoin addresses holding at least 1,000 BTC experienced a significant decline between December 16 and December 17, dropping from 2,108 to 2,061. This reduction highlights a notable sell-off or redistribution of holdings among large-scale investors.
The metric then stabilized until December 24, when it declined further to 2,049. Such changes in whale activity can have significant implications for Bitcoin, as these addresses typically represent entities with substantial influence over price movements due to their ability to make large trades.

Tracking these so-called Bitcoin whales is crucial because their buying and selling behaviors often serve as leading indicators for broader market trends. When whales accumulate, it suggests confidence in Bitcoin’s potential price growth, while large-scale selling can indicate caution or profit-taking, potentially triggering market declines.
After the steep declines in whale numbers, the metric began to rise modestly, with the current count at 2,056. This increase, though not occurring at a high pace, suggests a cautious return of confidence among major holders. This gradual accumulation may point to a stabilization in Bitcoin price in the short term.
BTC Price Prediction: Can It Go Back to $100,000?
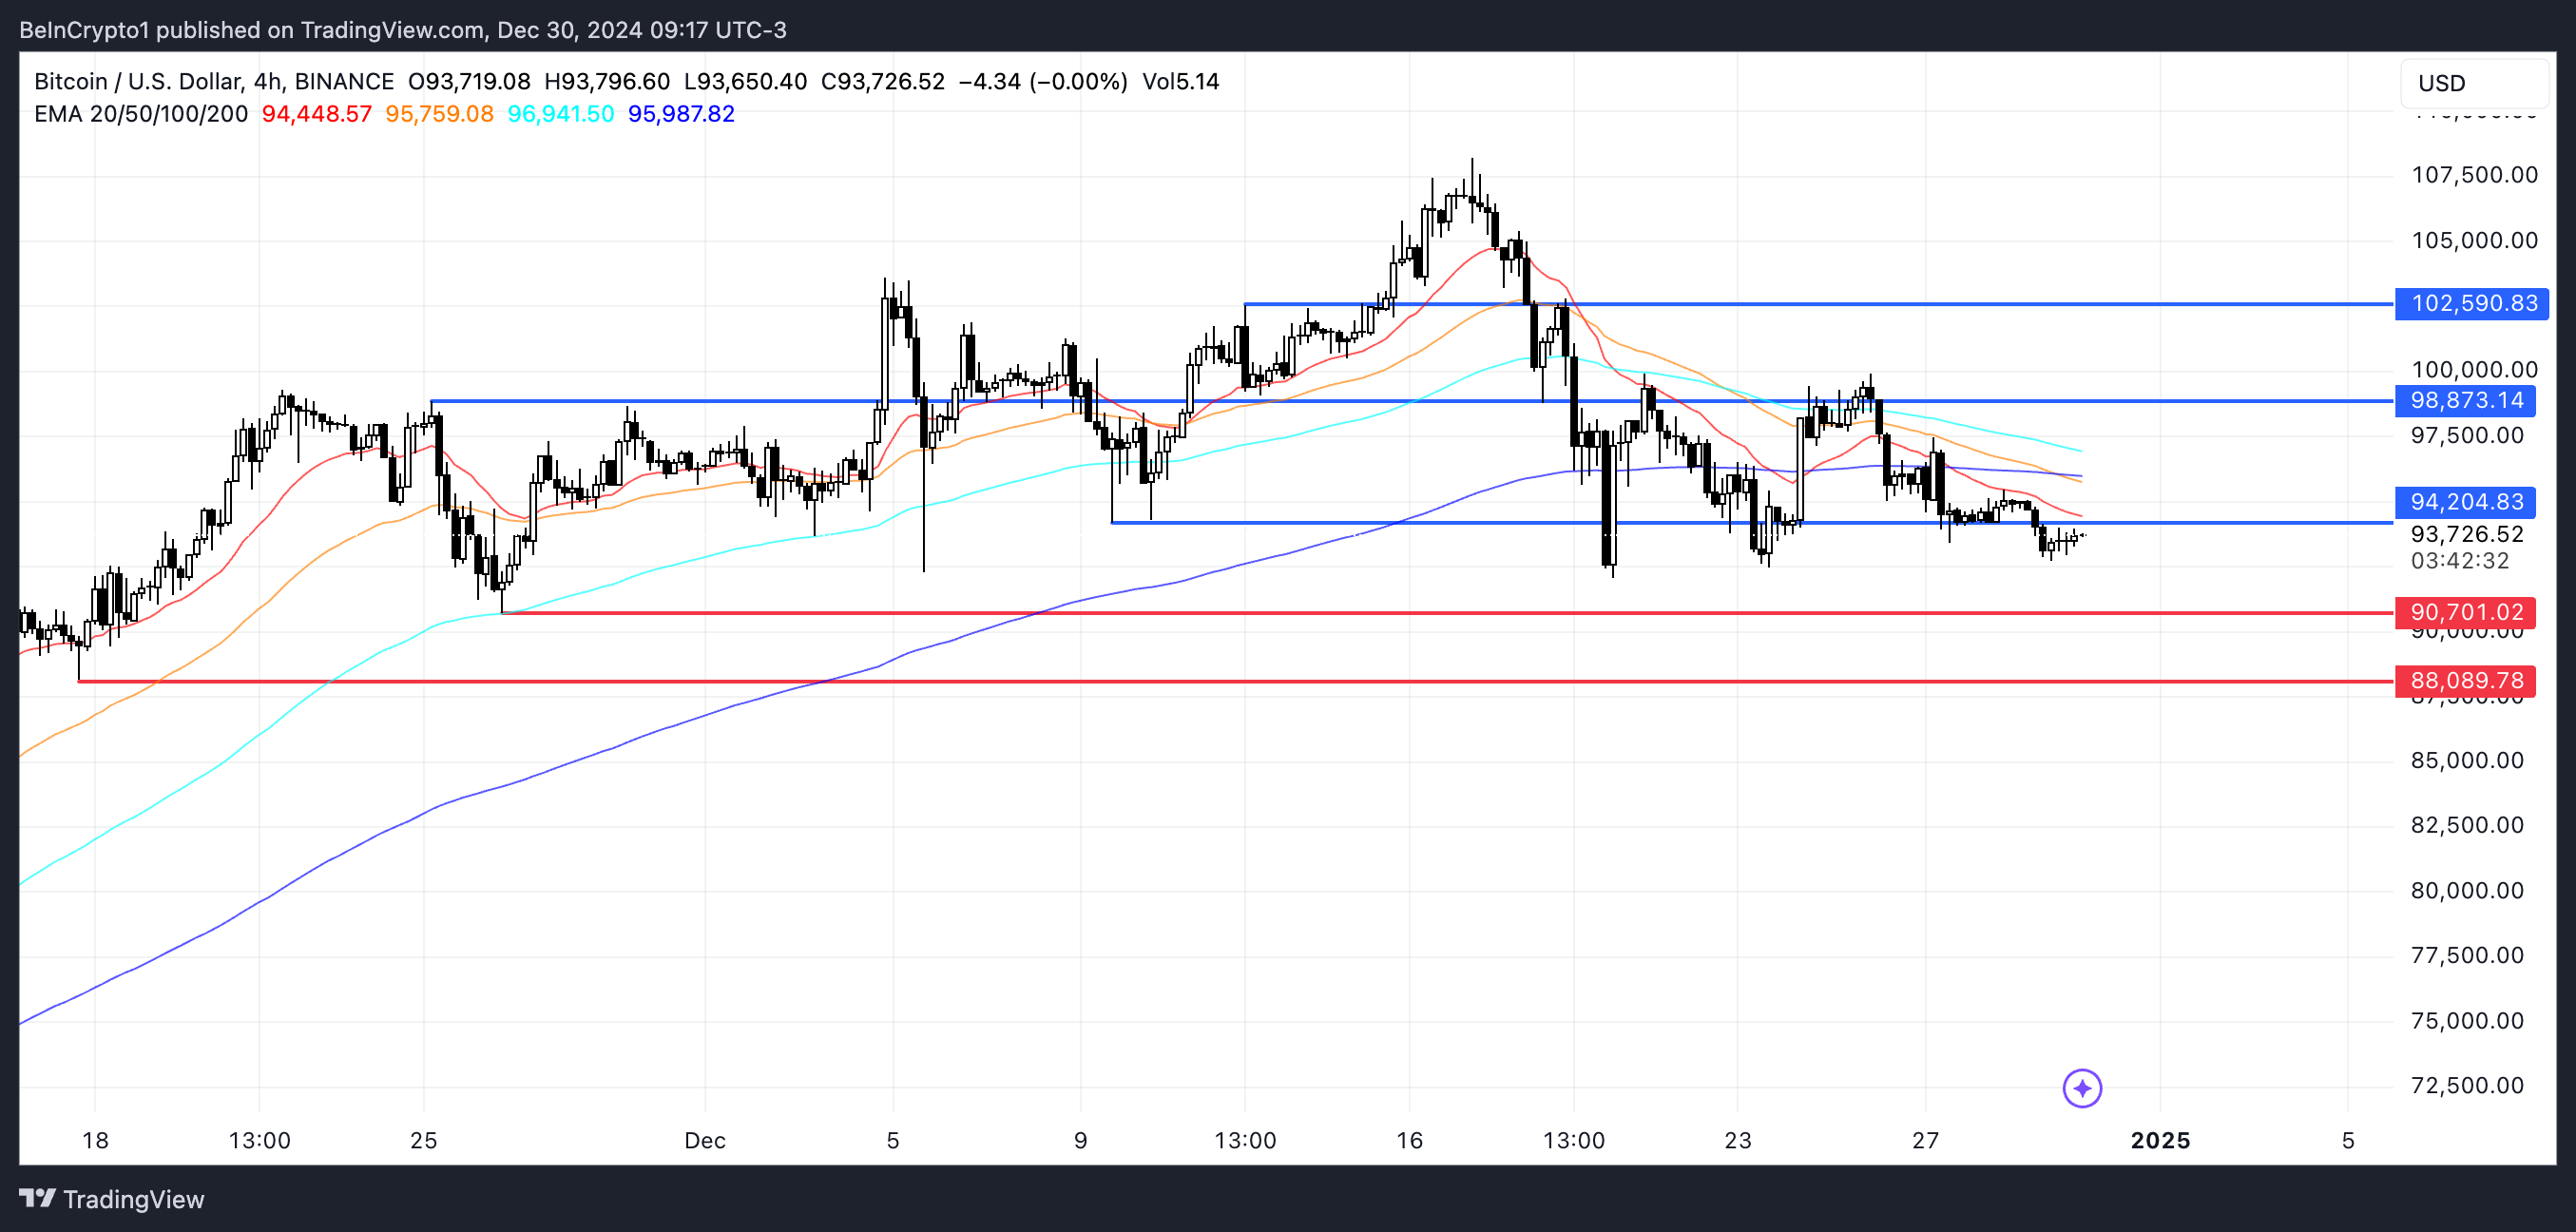
Bitcoin price is currently approaching a critical resistance level at $94,200. If this level is breached, it could open the door for further upward momentum, with potential tests of $98,700 and then $102,500 if the uptrend strengthens.

Despite the possibility of upward movement, the BTC EMA lines still indicate a bearish setup, with short-term EMAs positioned below long-term ones.
This configuration reflects lingering bearish sentiment in the market. Should the downtrend regain strength, BTC could retest the support at $90,700. If this support fails to hold, the next downside target could be $88,089.
Disclaimer
In line with the Trust Project guidelines, this price analysis article is for informational purposes only and should not be considered financial or investment advice. BeInCrypto is committed to accurate, unbiased reporting, but market conditions are subject to change without notice. Always conduct your own research and consult with a professional before making any financial decisions. Please note that our Terms and Conditions, Privacy Policy, and Disclaimers have been updated.


Kommentar hinterlassen