Before Federal Reserve Chair Jerome Powell announced a 25 basis point (bps) interest rate cut, Ethereum (ETH) holders were optimistic that the event would fuel a rally toward $4,500. However, the rate cut did not yield the anticipated bullish outcome, with ETH experiencing a 4.50% decline shortly afterward.
This drop has diminished hopes for a notable breakout, raising questions about what could be next for Ethereum.
Ethereum Changes It Reaction Compared to Last Rate Cut
Some months back, the Fed cut interest rates by 50 bps. This development drove a notable rally in crypto prices, including Ethereum. At that time, the sentiment leaned toward expectations of a similar rate cut before the year ended. However, this did not materialize.
Following yesterday’s decision, ETH’s price dropped from $3,890 to $3,624. While the cryptocurrency has recovered slightly, several on-chain indicators reveal that the attempted rebound could be a fakeout.
One of the indicators suggesting such is the price-Daily Active Addresses (DAA) divergence. The price DAA divergence checks if the user participation is growing alongside the price. When it is positive, it means engagement with the cryptocurrency has increased and is bullish for thhe price.
On the flip side, a negative rating indicates fewer interactions, which is bearish. According to Santiment, Ethereum’s price DAA divergence has declined to -98.28%, indicating lower user participation. Should this trend continue, ETH’s price could face a steeper price decrease.
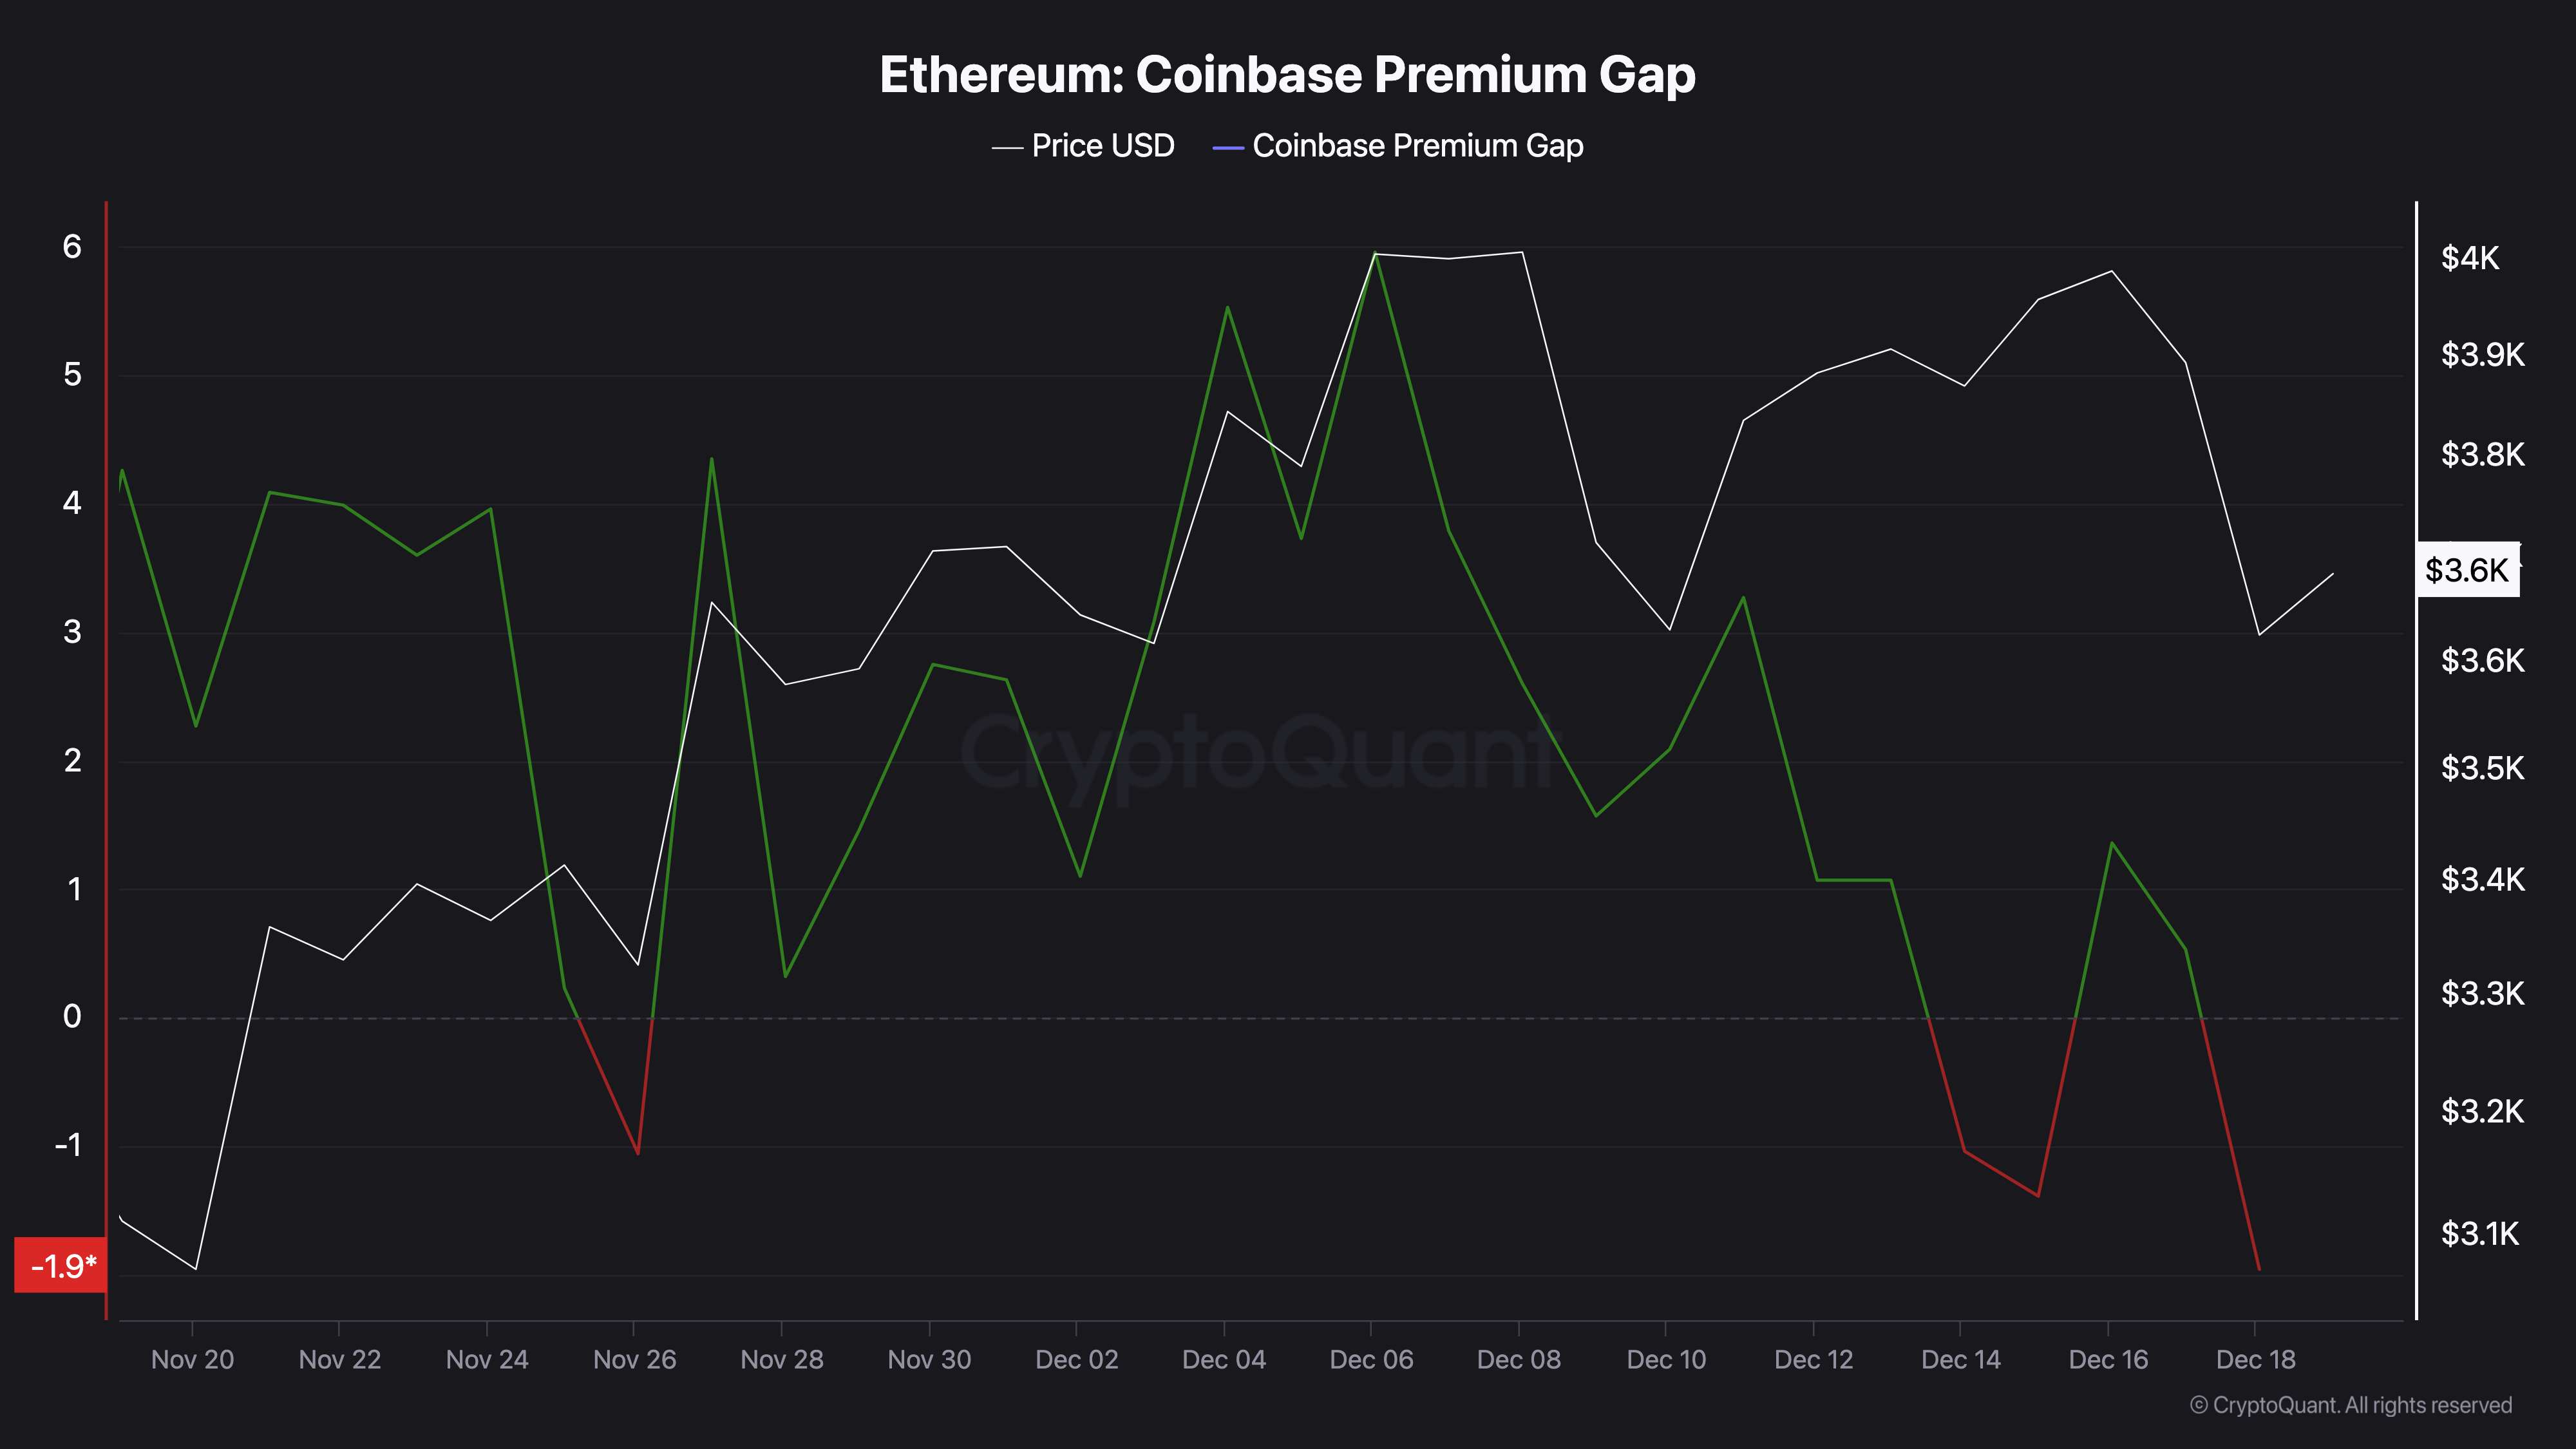
In addition to the metric above, the Coinbase Premium Gap is another indicator that supports a further ETH decline. This metric measures the price difference between the Coinbase ETH/USD pair and the same pair on Binance.
When there is a high premium price on Coinbase relative to Binance, it signals notable buying activity among US-based investors. This buying pressure may come from heightened demand within the region and favors a price uptick.

Conversely, when the price on Coinbase lags behind Binance, it might suggest a relative cooling of demand in the US market or stronger selling pressure from institutional or retail investors.
The chart above shows that the premium gap has fallen to -1.96, indicating significant selling pressure for ETH following the Fed rate cut.
ETH Price Prediction: Not Yet the Season for $4,500
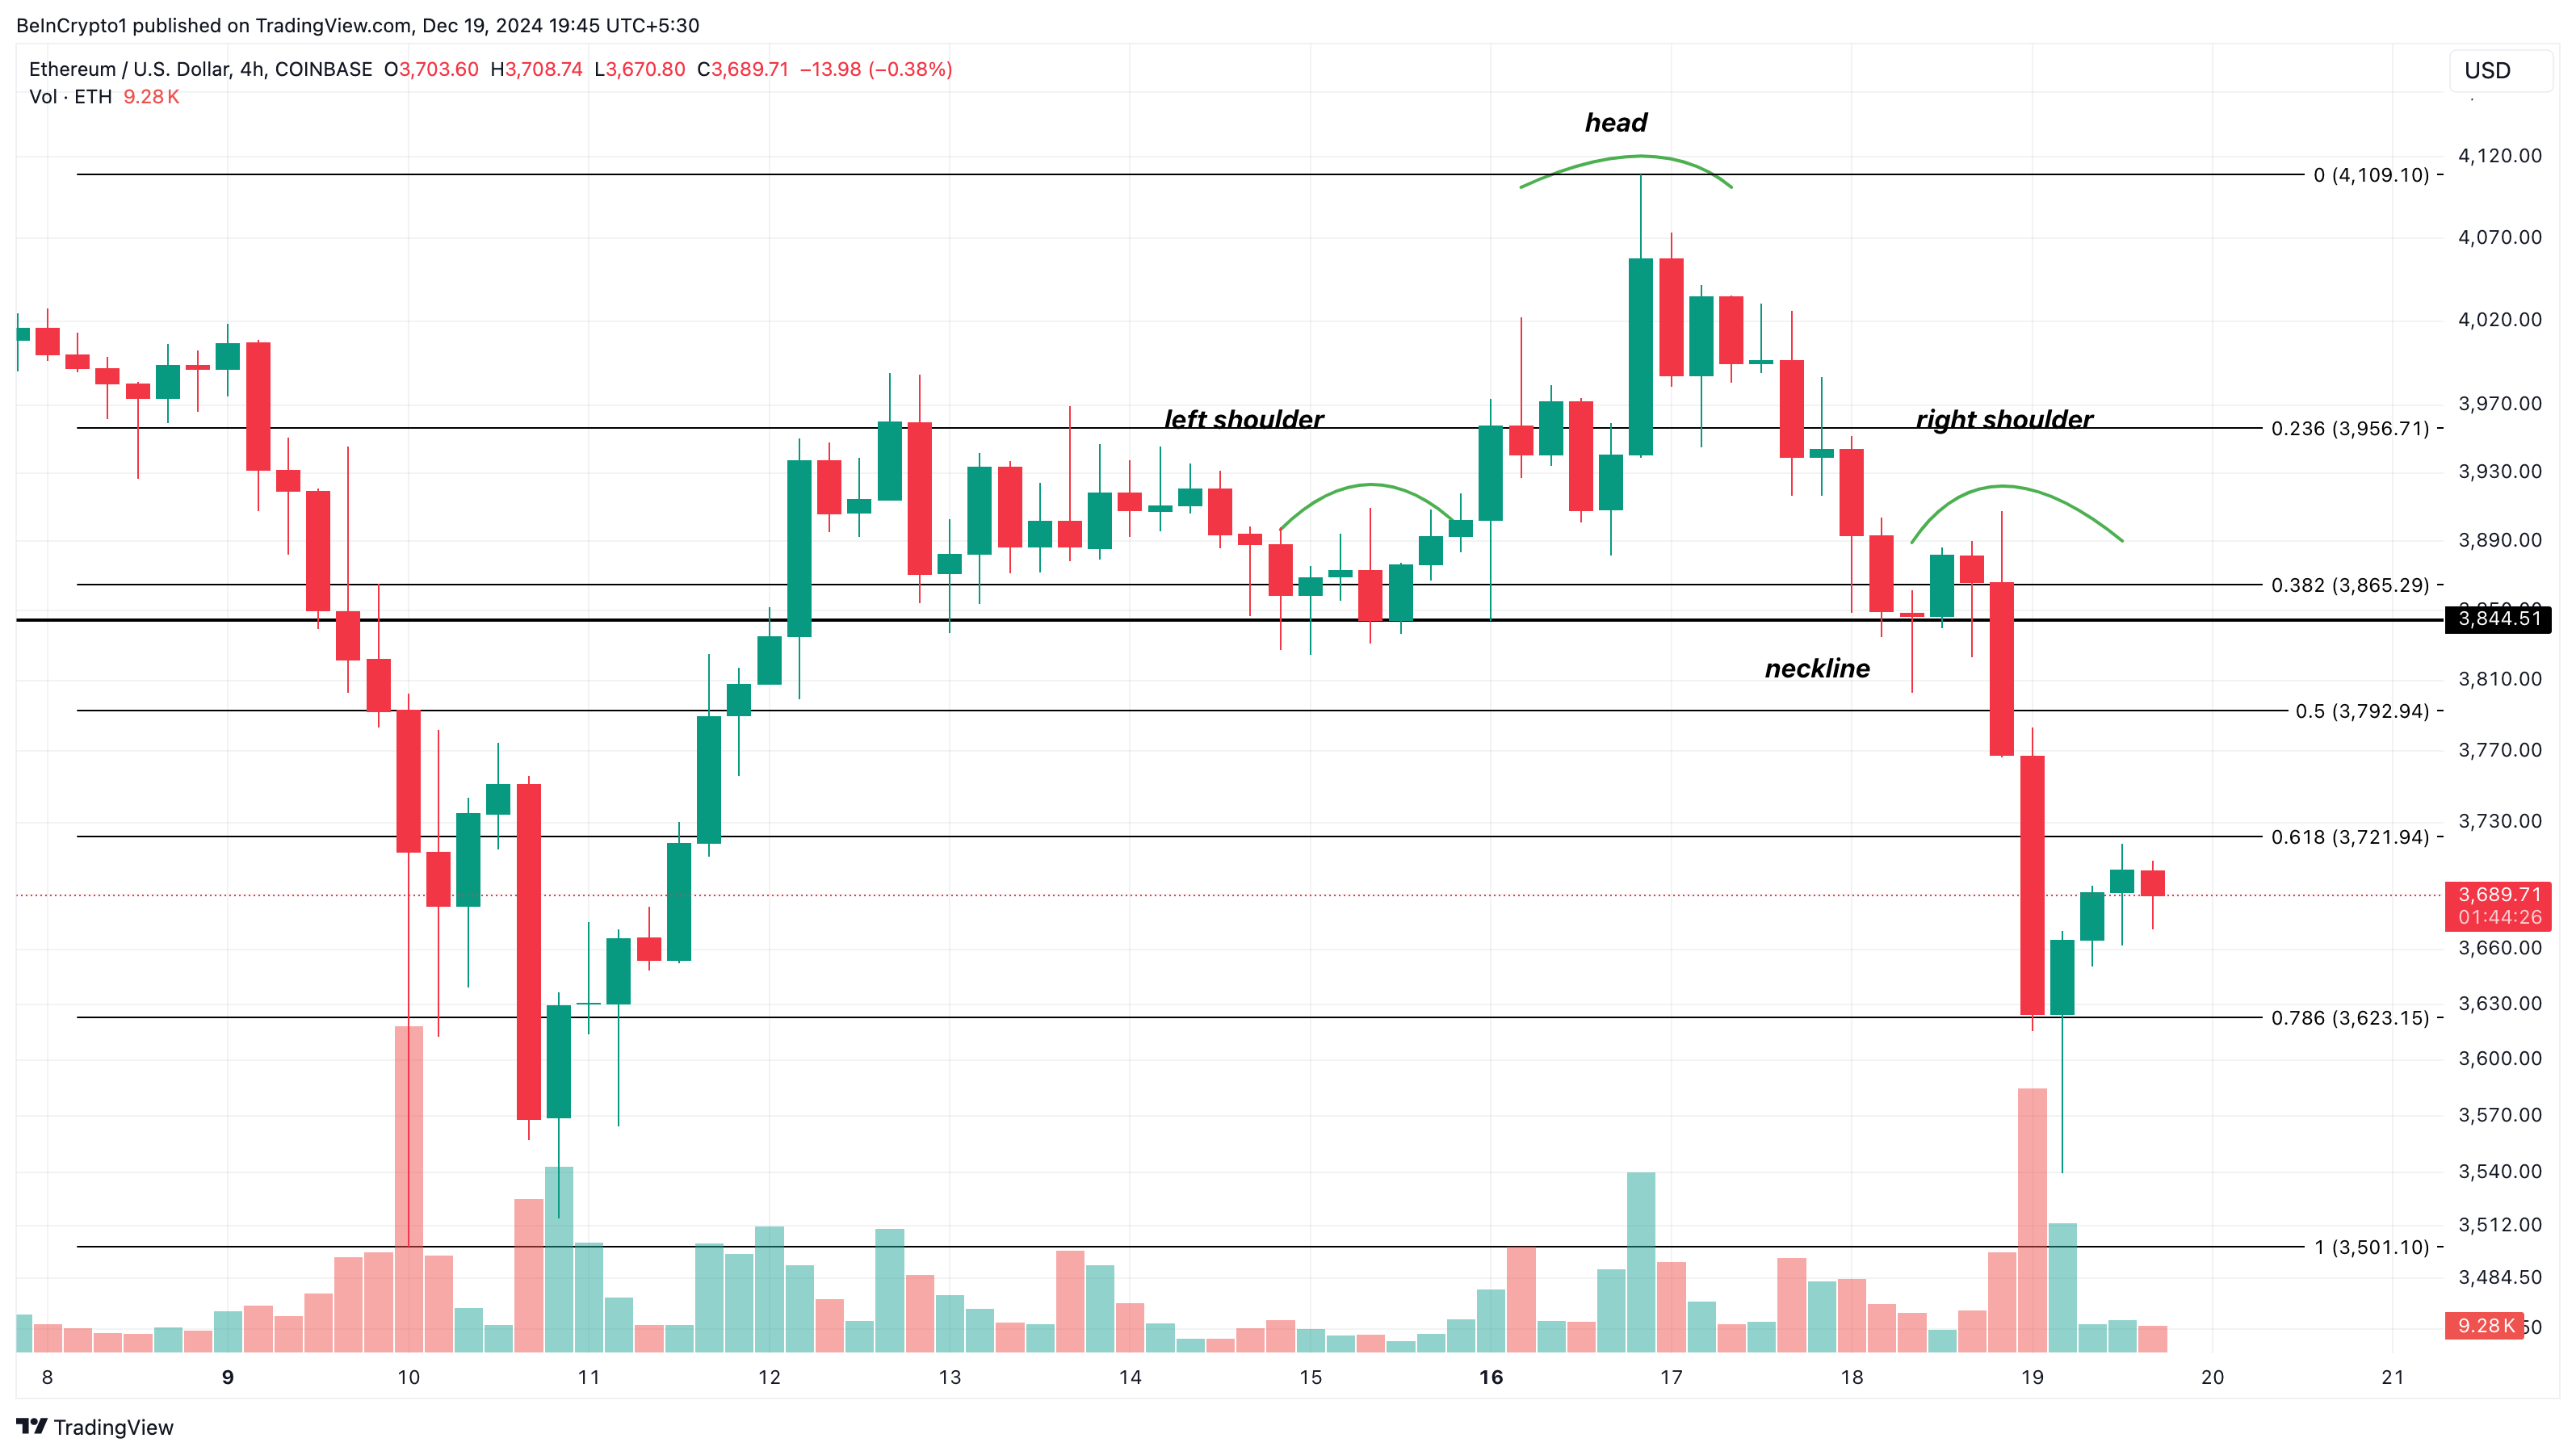
Beyond ETH Fed rate cut reaction, it experienced a decline due to the formation of a head-and-shoulders pattern on the 4-hour chart. A head-and-shoulders pattern is a classic technical analysis chart formation that signals a potential trend reversal from bullish to bearish.
The pattern features a price rise (left shoulder), followed by a peak (head), and then a decline (right shoulder). When the price breaks below the neckline after forming the right shoulder, it signals a bearish trend reversal.
However, the pattern’s reliability depends on the trading volume. As seen below, the volume around ETH has decreased, and the price has broken below the neckline.

Should this remain the same, then the ETH price might drop to $3,501. However, if volume increases alongside buying pressure, this prediction might not come to pass. Instead, Ethereum’s price might rise to 4,109 and eventually toward $4,500.
Disclaimer
In line with the Trust Project guidelines, this price analysis article is for informational purposes only and should not be considered financial or investment advice. BeInCrypto is committed to accurate, unbiased reporting, but market conditions are subject to change without notice. Always conduct your own research and consult with a professional before making any financial decisions. Please note that our Terms and Conditions, Privacy Policy, and Disclaimers have been updated.


Kommentar hinterlassen