


Alongside many other altcoins, ETH’s price continues to struggle, and its future now hinges on some critical support levels. If these key levels fail to hold, ETH could face a prolonged bearish period.
Recent price action has shown that Ethereum (ETH) could be on the verge of bidding farewell to this cycle, which many have tagged as the enduring phase of the bull market.
Ethereum Is About to Lose the Battle
Six months ago, Ethereum’s Market Value to Realized Value (MVRV) Long/Short Difference hit a yearly high of 55%. This on-chain indicator is key during bull markets, as it reveals whether short-term holders have more unrealized profits than long-term holders.
When the MVRV Long/Short Difference rises, long-term holders gain the advantage. A drop, especially into the negative range, signals the opposite. As of now, the reading stands at 2.08%, indicating that many long-term ETH holders have exited profitable positions.
If this trend continues, the reading could turn negative. The last time this occurred was in February 2022, followed by a year-long bear market across cryptocurrencies, including Ethereum.
Read more: 9 Best Places To Stake Ethereum in 2024

If the current trend mirrors previous patterns, expectations of Ethereum reaching five digits in this cycle may be unrealistic.
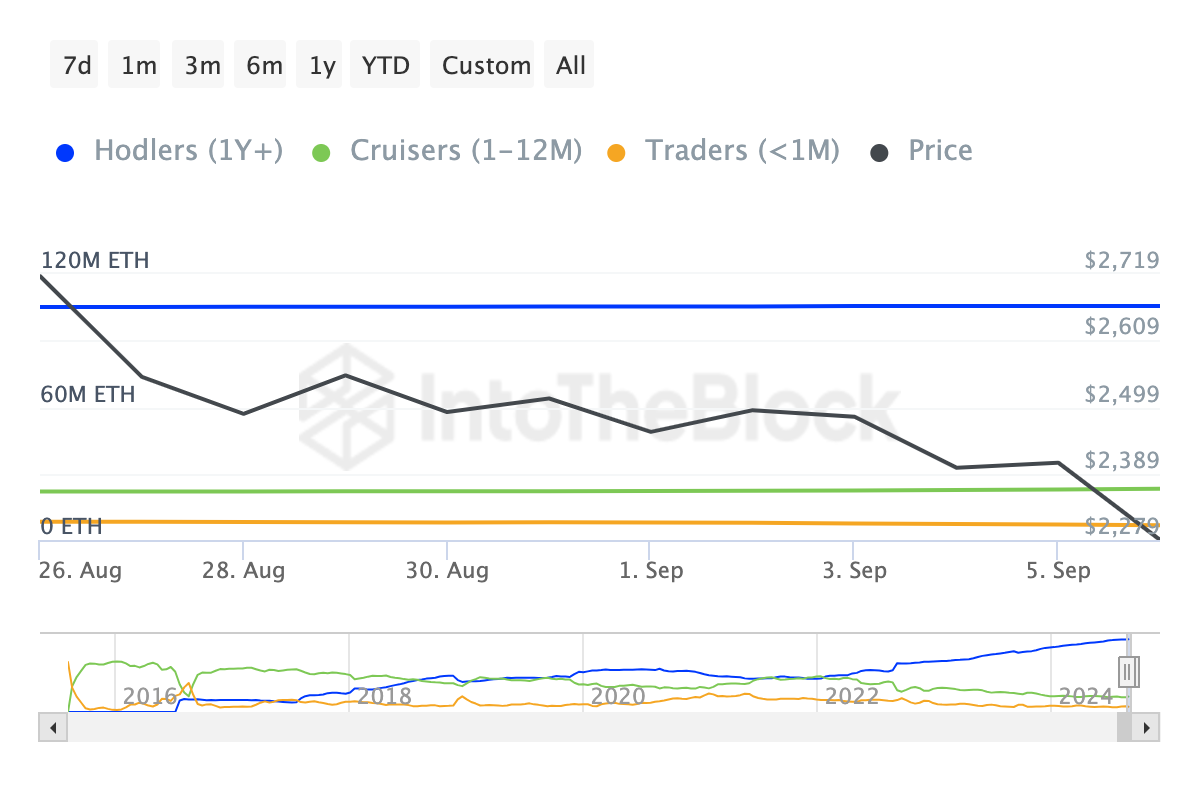
Another indicator reinforcing this sentiment is the Balance by Time Held metric, which measures how long participants hold a cryptocurrency. Typically, an increase in this metric shows that holders are not selling, indicating confidence in a bull cycle.
However, ETH’s balance held over the past 30 days has increased, suggesting that some holders are losing confidence in the altcoin’s short- to long-term potential, potentially signaling a shift in market sentiment.

ETH Price Prediction: Bulls Can’t Hold On
The Moving Average Convergence Divergence (MACD) on the daily timeframe shows that Ethereum’s price continues to endure bearish momentum. The MACD uses the position of the 12 and 26-day Exponential Moving Average (EMA) to determine momentum.
A positive MACD reading implies a bullish momentum. Negative readings, on the other hand, suggest likely pressure to the downside. From the image below, ETH’s price needs to stay above $2,220 to prevent a notable price crash.
However, given the current market conditions, a drop below $2,000 seems likely. That said, consistent buying pressure could help stabilize Ethereum’s weak performance and prevent further declines.
Read more: How to Invest in Ethereum ETFs?

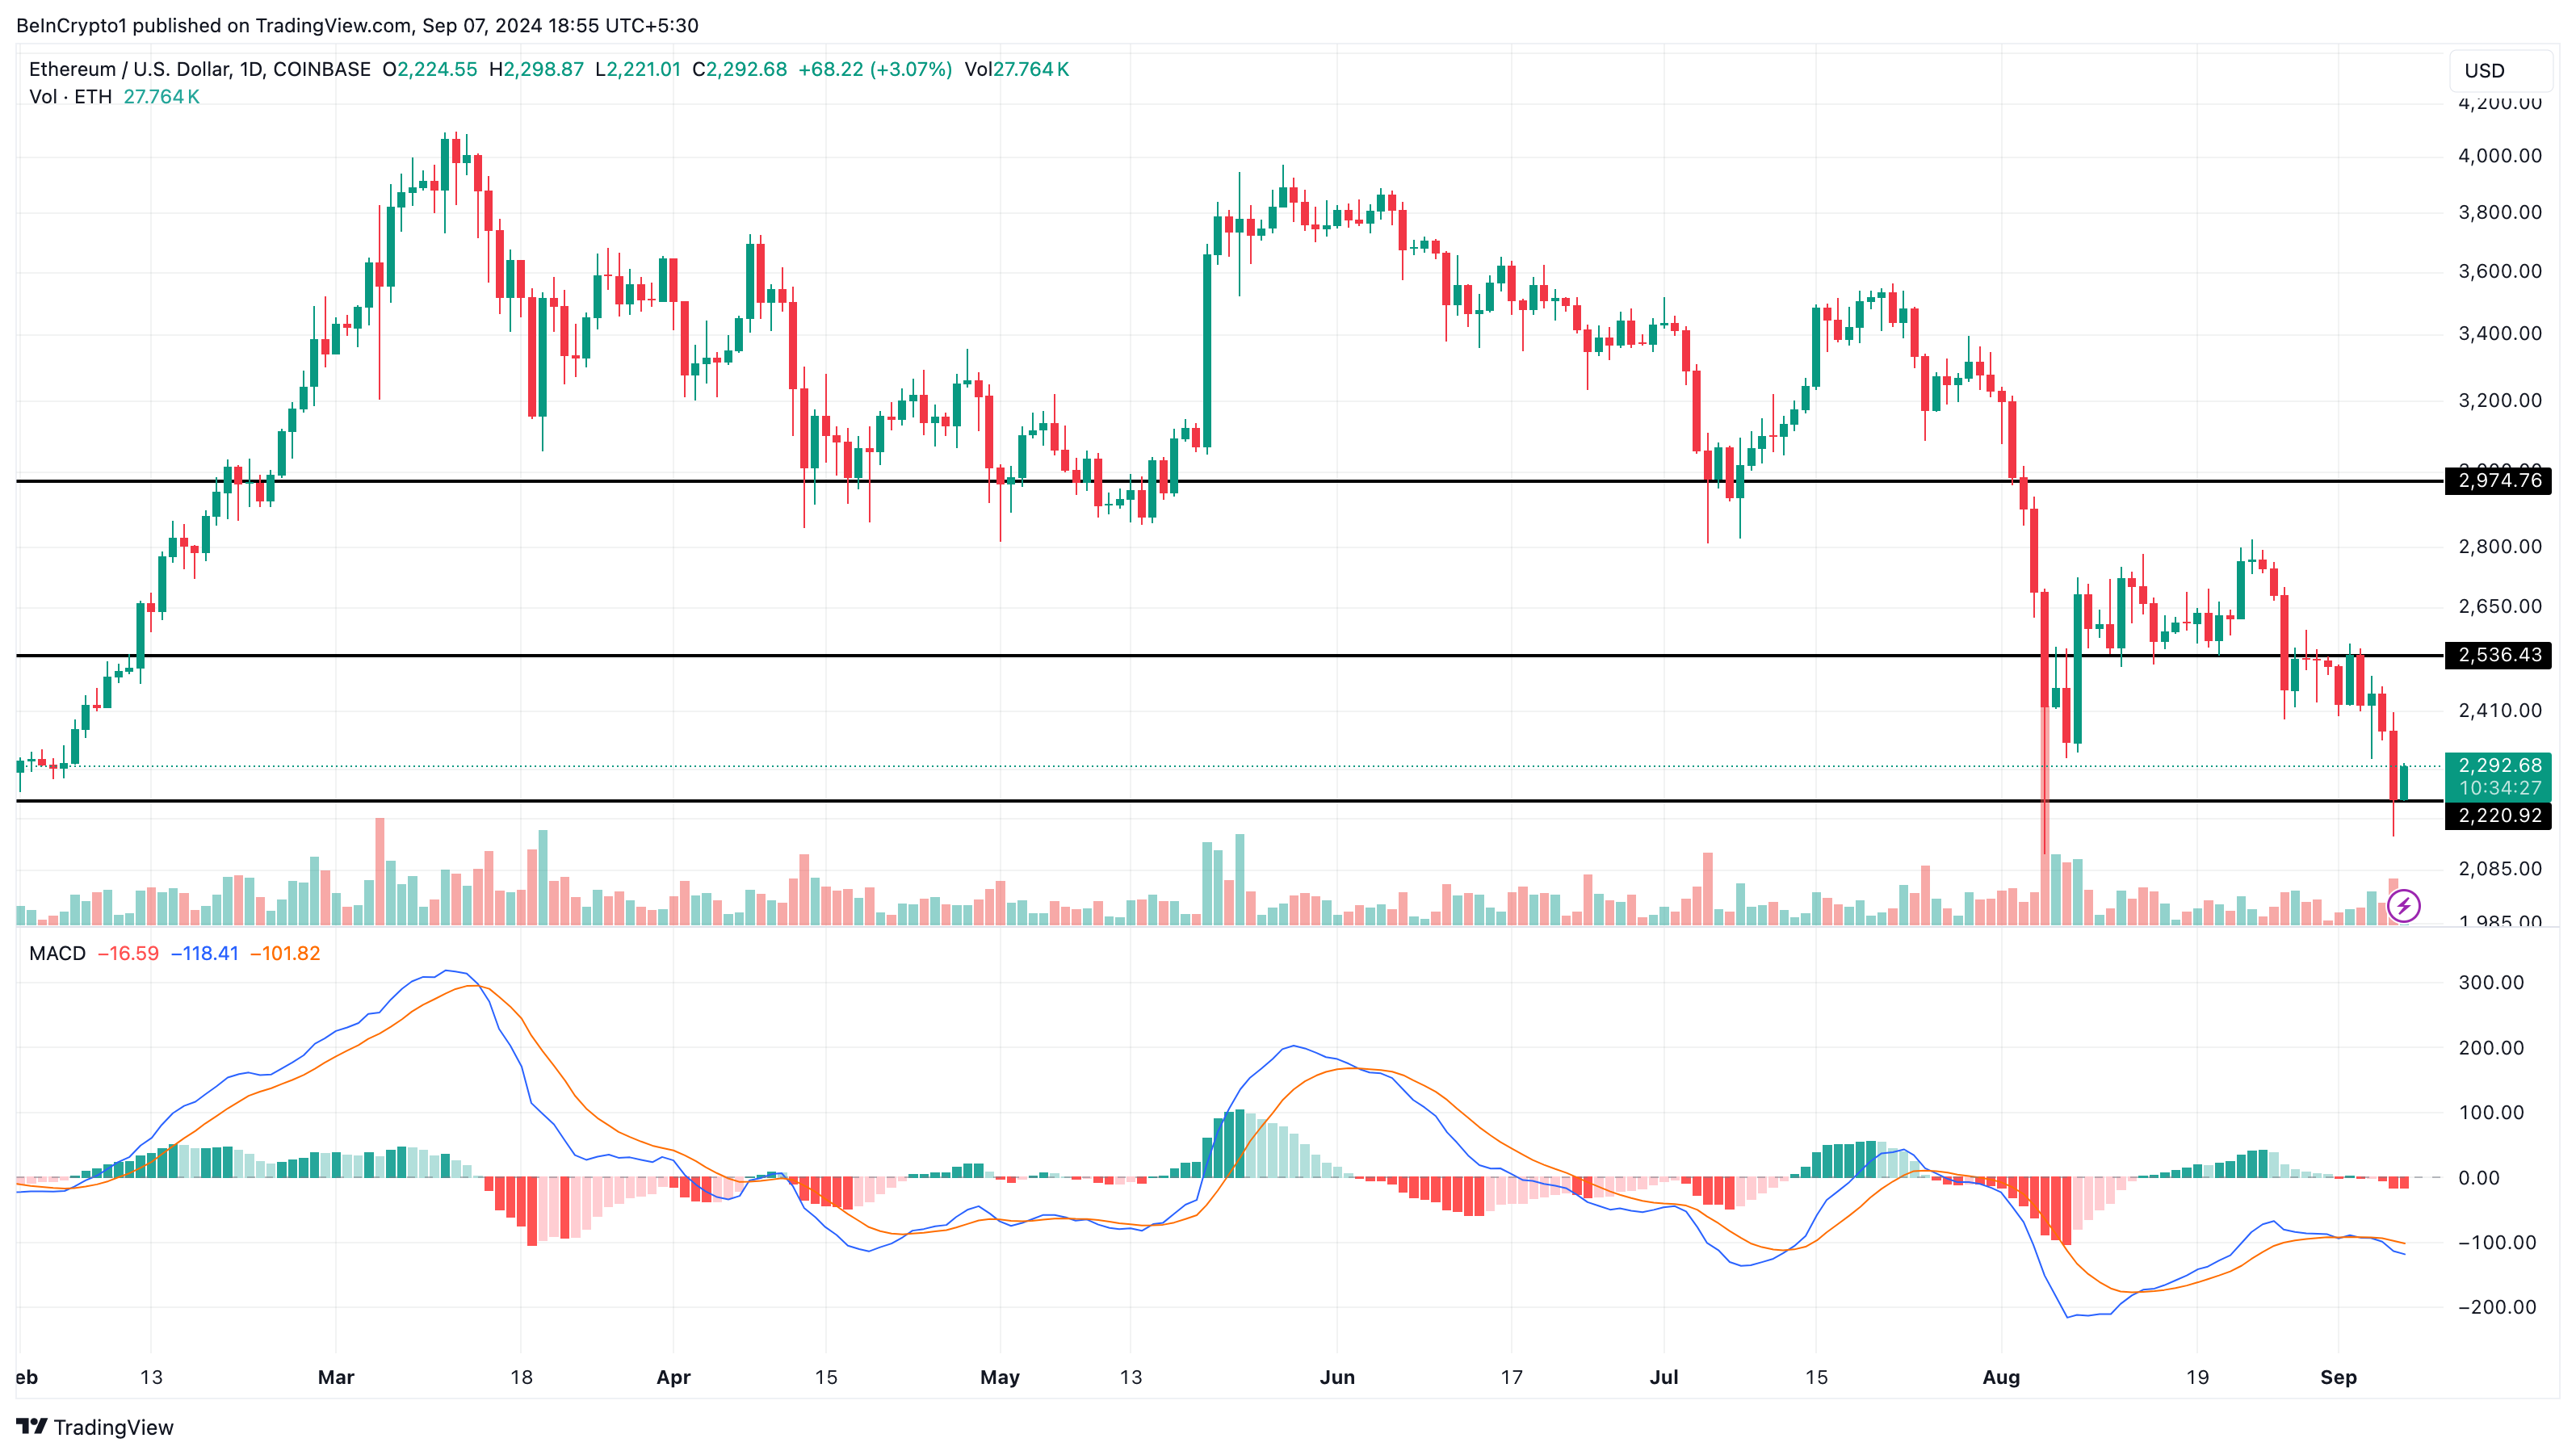
If this happens, the price might jump toward $2,536 and probably $2.974, possibly invalidating the bull market exit.
Disclaimer
In line with the Trust Project guidelines, this price analysis article is for informational purposes only and should not be considered financial or investment advice. BeInCrypto is committed to accurate, unbiased reporting, but market conditions are subject to change without notice. Always conduct your own research and consult with a professional before making any financial decisions. Please note that our Terms and Conditions, Privacy Policy, and Disclaimers have been updated.


Kommentar hinterlassen